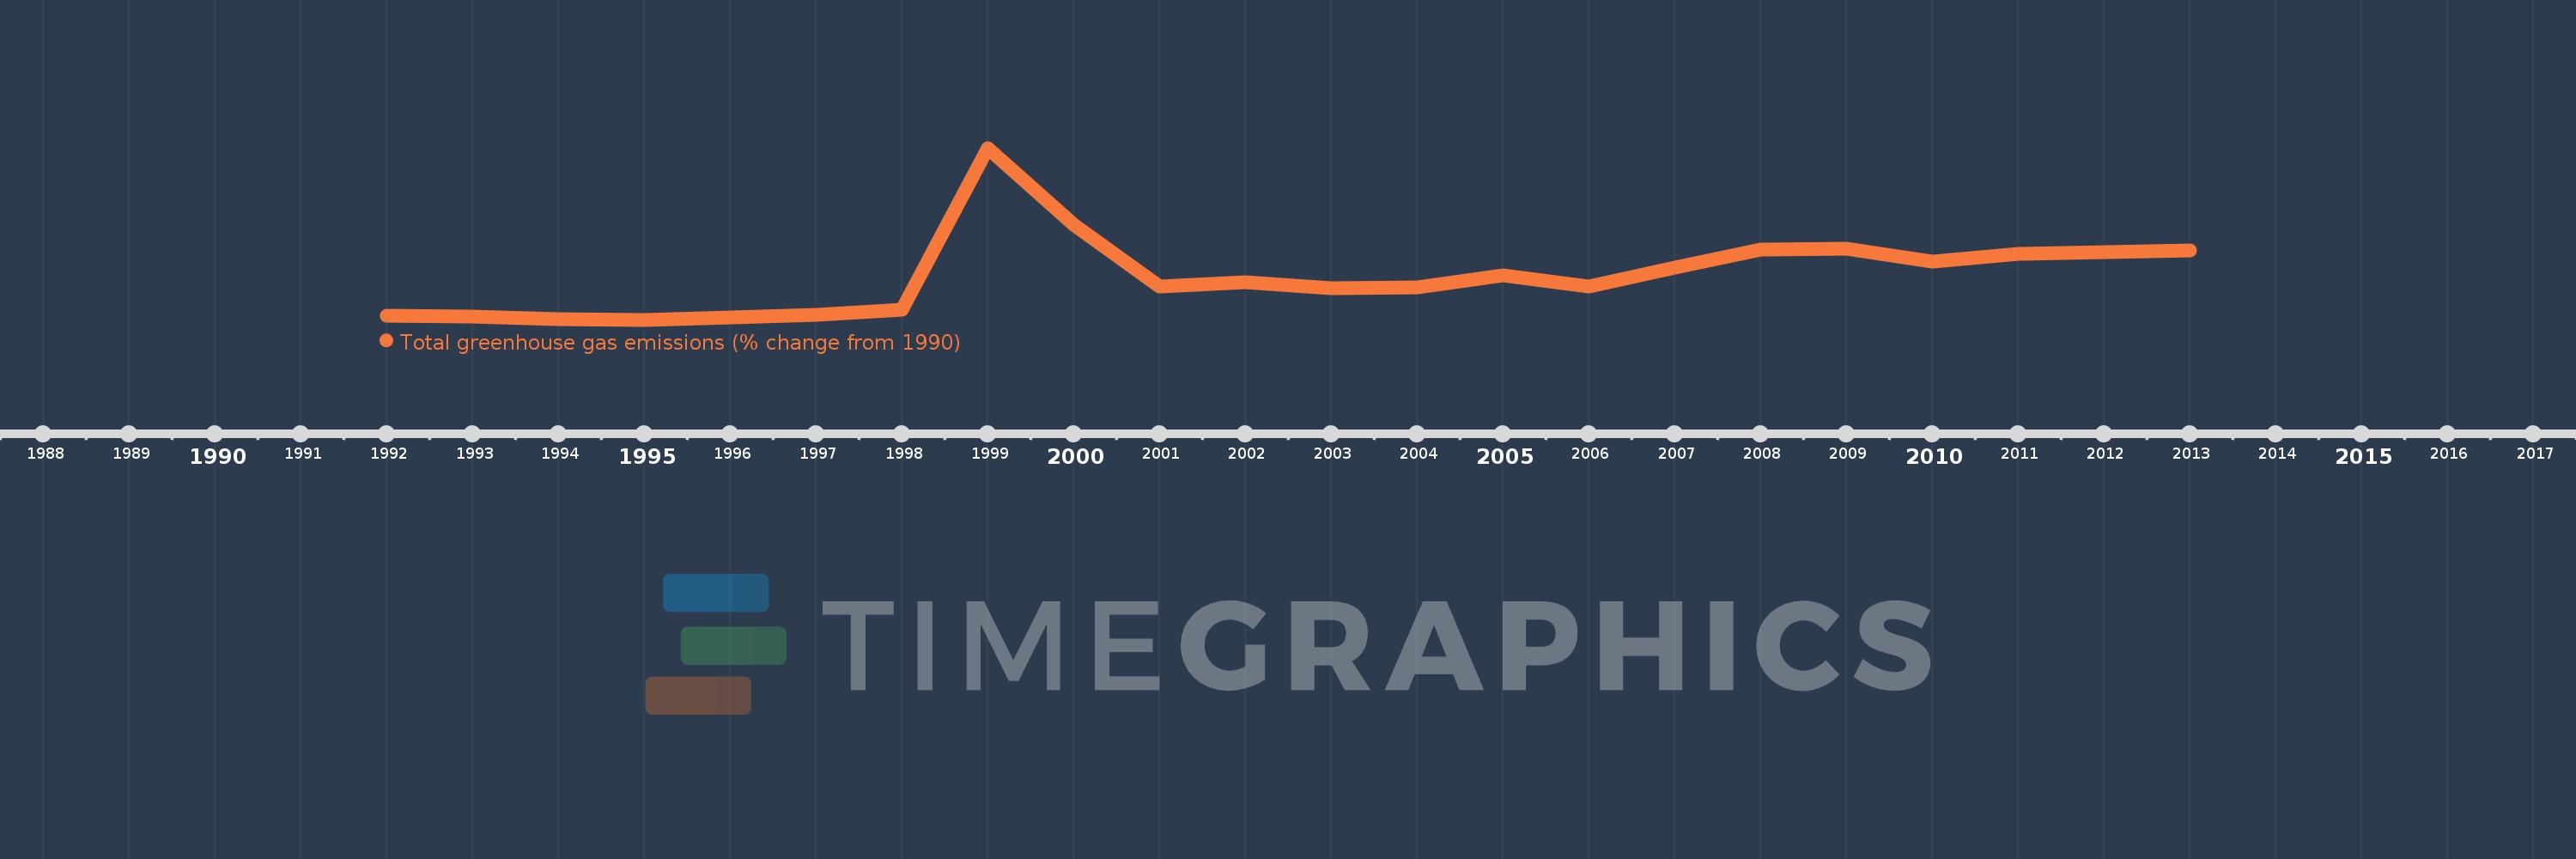
This timeline shows a graph from 1992 to 2013 of Liberia. No data until 1991. Number of actual observations by date: 22.
Source name:
World Development Indicators
Source organization:
World Bank staff estimates from original source: European Commission, Joint Research Centre (JRC)/Netherlands Environmental Assessment Agency (PBL). Emission Database for Global Atmospheric Research (EDGAR): http://edgar.jrc.ec.europa.eu/.
Categories, topics:
Climate Change, Environment
Last updated:
apr 23, 2017
Indicators value changes by year
Meaning:
30.999
Minimum:
-20.937
jan 1, 1995
Maximum:
184.185
jan 1, 1999
At the date of observation
Value
Absolute change
Change from the previous value
jan 1, 1992
-15.734
-15.734
0.0%
jan 1, 1993
-17.628
-1.894
12.04%
jan 1, 1994
-19.759
-2.131
12.09%
jan 1, 1995
-20.937
-1.178
5.96%
jan 1, 1996
-18.512
+2.425
-11.58%
jan 1, 1997
-14.869
+3.642
-19.68%
jan 1, 1998
-8.566
+6.303
-42.39%
jan 1, 1999
184.185
+192.751
-2.25K%
jan 1, 2000
92.37
-91.815
-49.85%
jan 1, 2001
18.476
-73.894
-80.0%
jan 1, 2002
23.474
+4.998
27.05%
jan 1, 2003
16.814
-6.66
-28.37%
jan 1, 2004
17.71
+0.897
5.33%
jan 1, 2005
31.898
+14.188
80.11%
jan 1, 2006
18.84
-13.058
-40.94%
jan 1, 2007
41.276
+22.436
119.09%
jan 1, 2008
62.486
+21.21
51.39%
jan 1, 2009
63.372
+0.886
1.42%
jan 1, 2010
48.346
-15.026
-23.71%
jan 1, 2011
57.404
+9.058
18.74%
jan 1, 2012
59.619
+2.215
3.86%
jan 1, 2013
61.706
+2.087
3.5%
Ranking of countries by current statistics by years