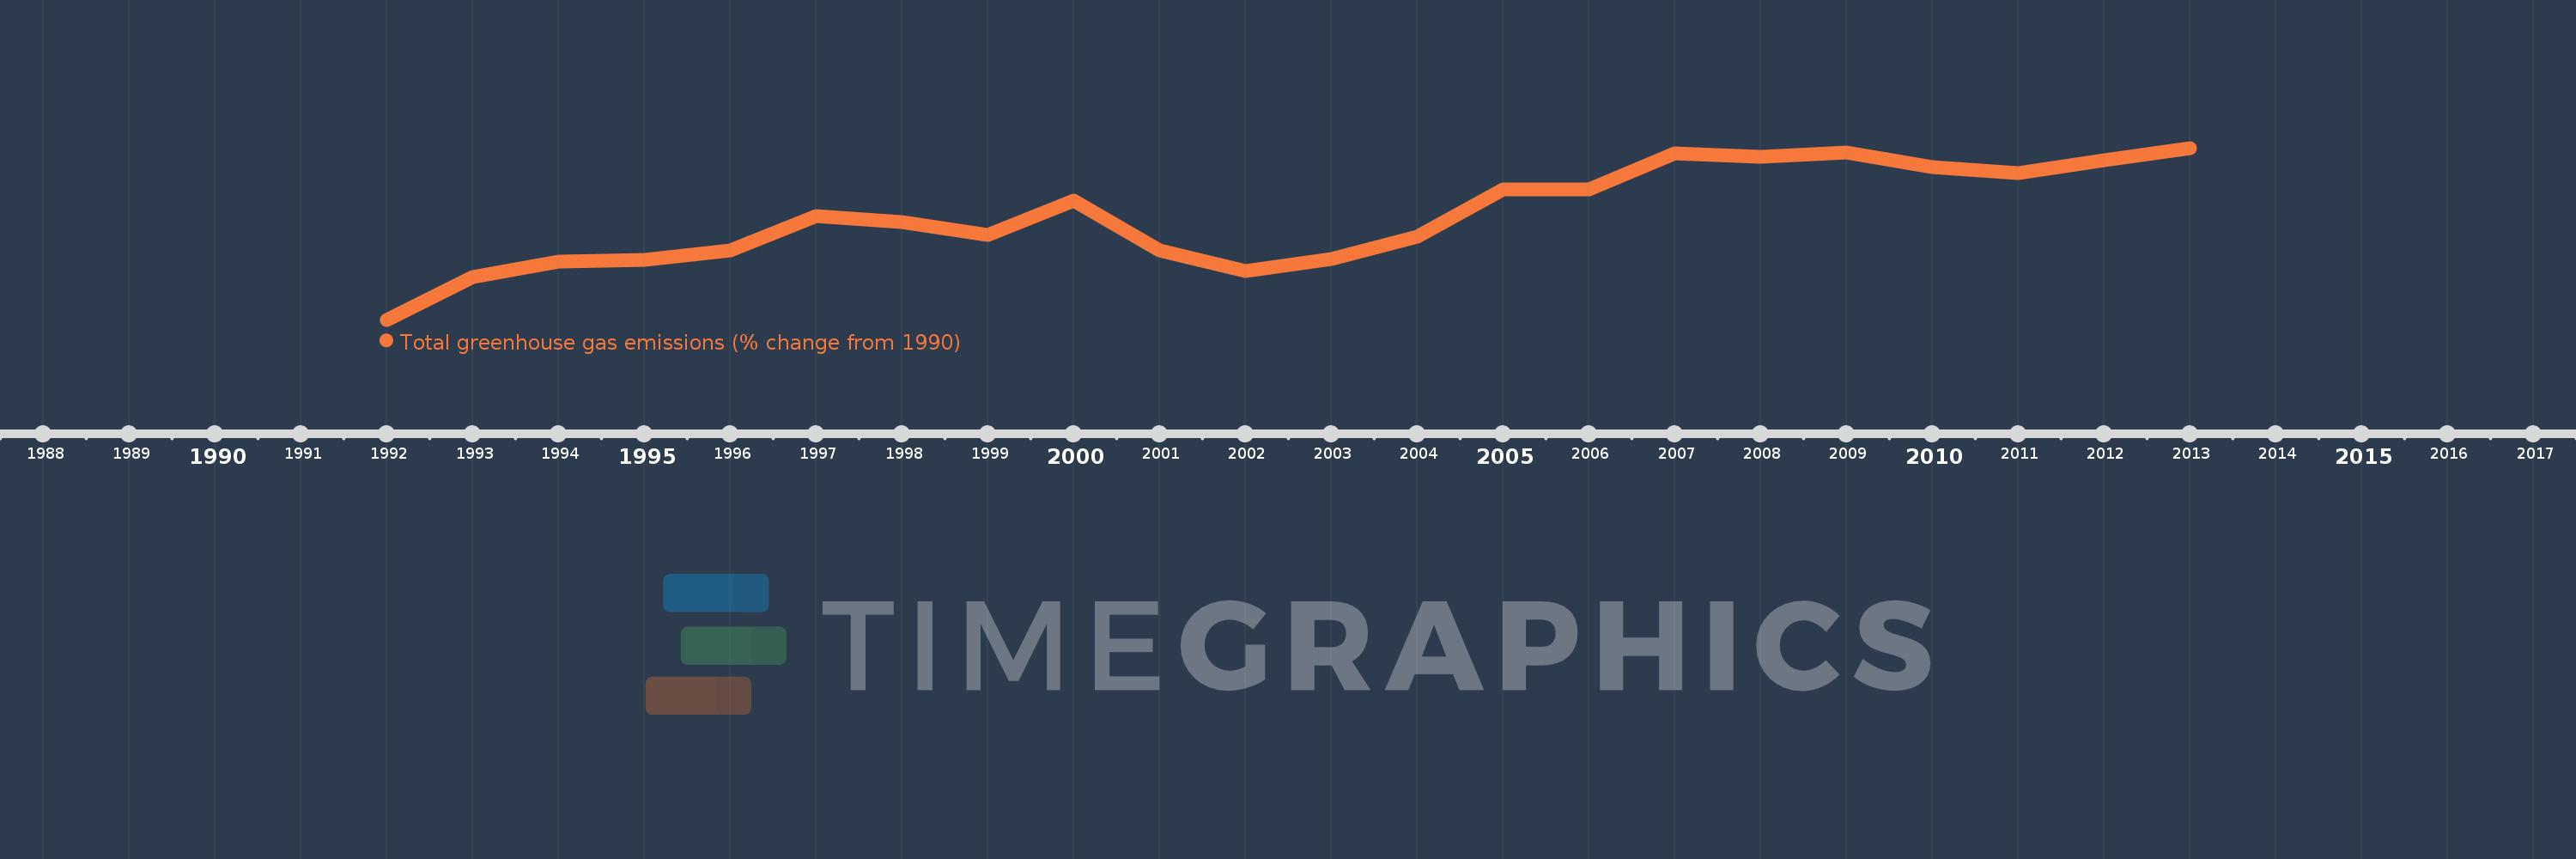
This timeline shows a graph from 1992 to 2013 of Uruguay. No data until 1991. Number of actual observations by date: 22.
Source name:
World Development Indicators
Source organization:
World Bank staff estimates from original source: European Commission, Joint Research Centre (JRC)/Netherlands Environmental Assessment Agency (PBL). Emission Database for Global Atmospheric Research (EDGAR): http://edgar.jrc.ec.europa.eu/.
Categories, topics:
Climate Change, Environment
Last updated:
apr 23, 2017
Indicators value changes by year
Meaning:
21.347
Minimum:
6.406
jan 1, 1992
Maximum:
31.121
jan 1, 2013
At the date of observation
Value
Absolute change
Change from the previous value
jan 1, 1992
6.406
+6.406
0.0%
jan 1, 1993
12.566
+6.16
96.15%
jan 1, 1994
14.757
+2.191
17.44%
jan 1, 1995
15.009
+0.252
1.71%
jan 1, 1996
16.36
+1.351
9.0%
jan 1, 1997
21.381
+5.021
30.69%
jan 1, 1998
20.475
-0.906
-4.24%
jan 1, 1999
18.626
-1.849
-9.03%
jan 1, 2000
23.571
+4.945
26.55%
jan 1, 2001
16.331
-7.24
-30.72%
jan 1, 2002
13.465
-2.866
-17.55%
jan 1, 2003
15.126
+1.661
12.34%
jan 1, 2004
18.382
+3.256
21.53%
jan 1, 2005
25.181
+6.799
36.99%
jan 1, 2006
25.189
+0.008
0.03%
jan 1, 2007
30.346
+5.157
20.47%
jan 1, 2008
29.787
-0.559
-1.84%
jan 1, 2009
30.411
+0.624
2.09%
jan 1, 2010
28.333
-2.078
-6.83%
jan 1, 2011
27.473
-0.86
-3.03%
jan 1, 2012
29.344
+1.871
6.81%
jan 1, 2013
31.121
+1.777
6.06%
Ranking of countries by current statistics by years