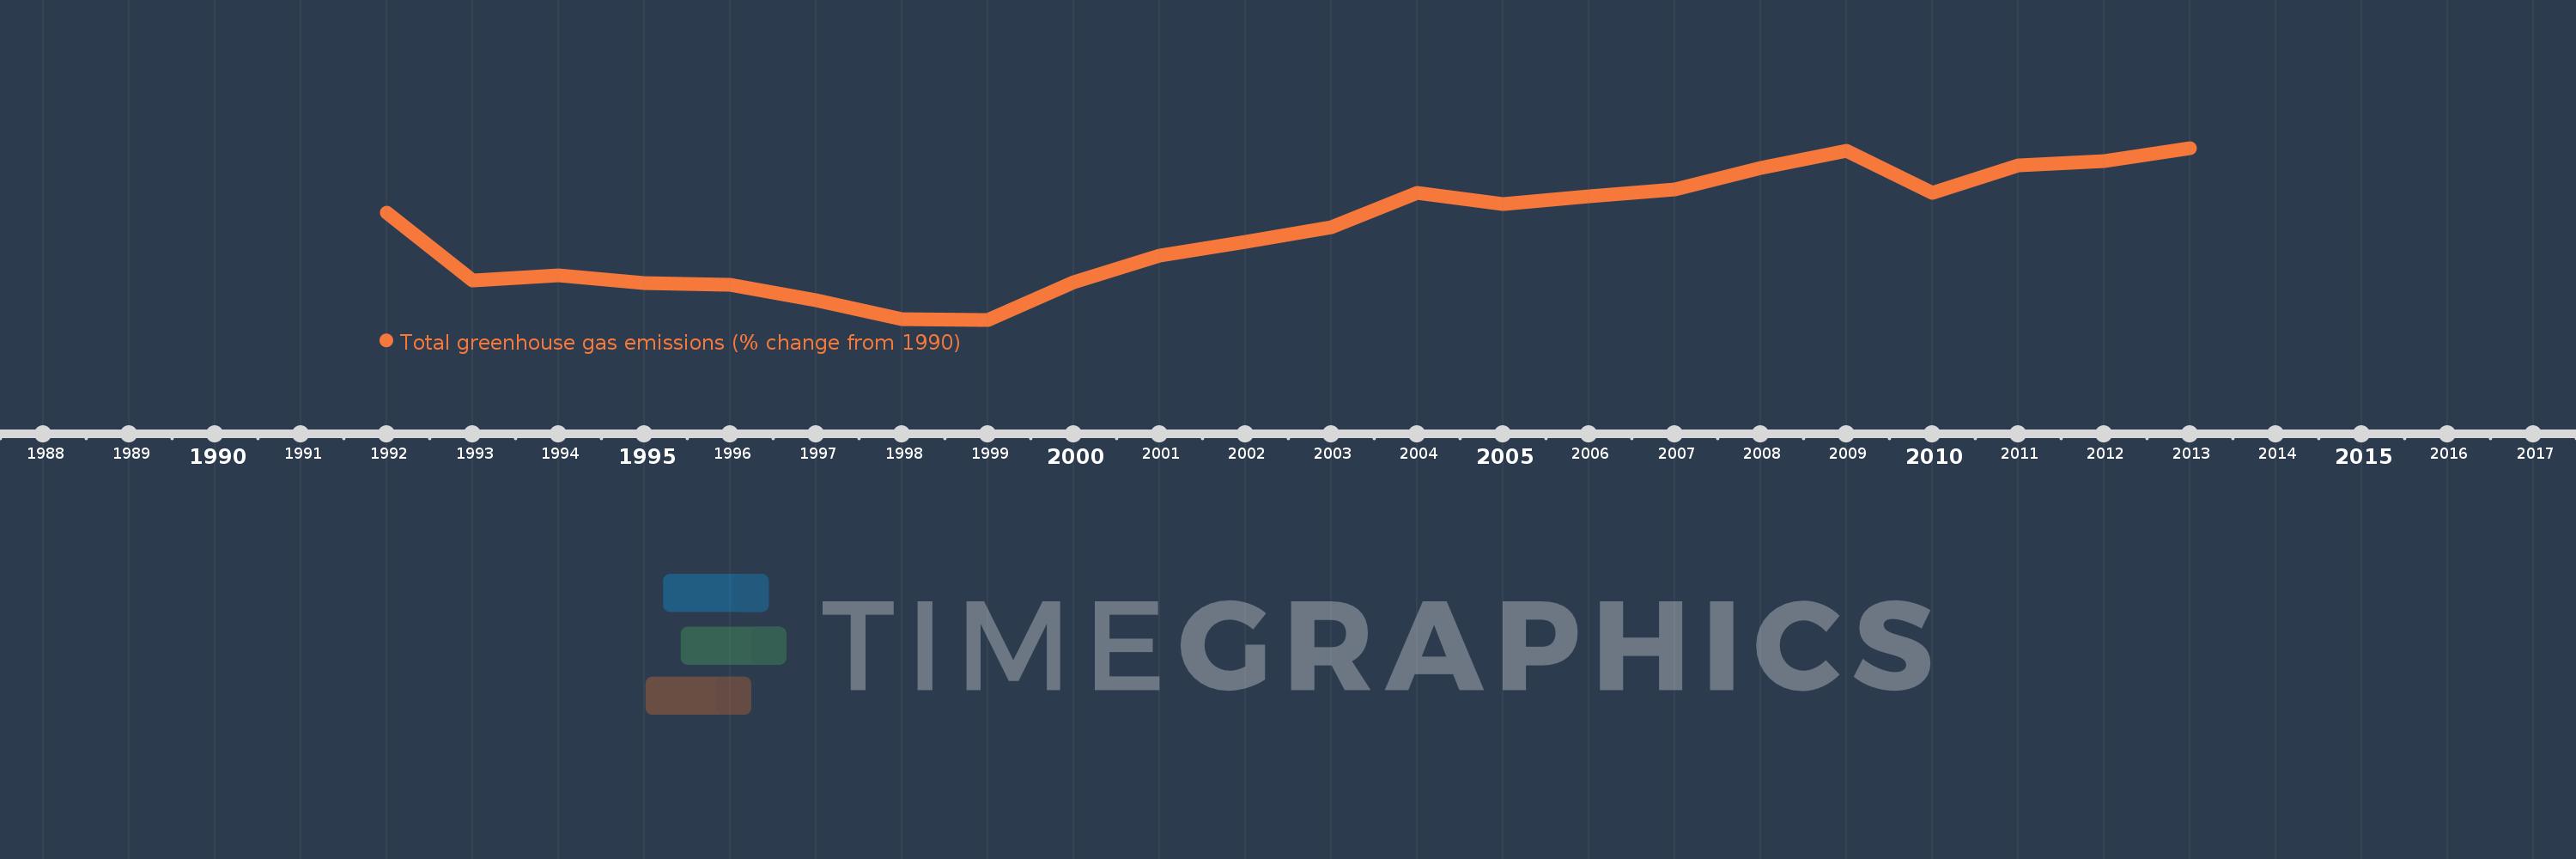
This timeline shows a graph from 1992 to 2013 of Turkmenistan. No data until 1991. Number of actual observations by date: 22.
Source name:
World Development Indicators
Source organization:
World Bank staff estimates from original source: European Commission, Joint Research Centre (JRC)/Netherlands Environmental Assessment Agency (PBL). Emission Database for Global Atmospheric Research (EDGAR): http://edgar.jrc.ec.europa.eu/.
Categories, topics:
Climate Change, Environment
Last updated:
apr 23, 2017
Indicators value changes by year
Meaning:
-13.748
Minimum:
-43.652
jan 1, 1999
Maximum:
13.336
jan 1, 2013
At the date of observation
Value
Absolute change
Change from the previous value
jan 1, 1992
-8.017
-8.017
0.0%
jan 1, 1993
-30.771
-22.754
283.83%
jan 1, 1994
-28.924
+1.847
-6.0%
jan 1, 1995
-31.42
-2.496
8.63%
jan 1, 1996
-32.076
-0.656
2.09%
jan 1, 1997
-37.175
-5.1
15.9%
jan 1, 1998
-43.583
-6.408
17.24%
jan 1, 1999
-43.652
-0.069
0.16%
jan 1, 2000
-31.179
+12.473
-28.57%
jan 1, 2001
-22.249
+8.929
-28.64%
jan 1, 2002
-17.724
+4.525
-20.34%
jan 1, 2003
-12.908
+4.816
-27.17%
jan 1, 2004
-1.592
+11.316
-87.67%
jan 1, 2005
-5.367
-3.775
237.18%
jan 1, 2006
-2.651
+2.716
-50.6%
jan 1, 2007
-0.373
+2.278
-85.92%
jan 1, 2008
6.583
+6.956
-1.86K%
jan 1, 2009
12.464
+5.881
89.33%
jan 1, 2010
-1.618
-14.082
-112.98%
jan 1, 2011
7.436
+9.054
-559.66%
jan 1, 2012
8.996
+1.56
20.98%
jan 1, 2013
13.336
+4.339
48.24%
Ranking of countries by current statistics by years