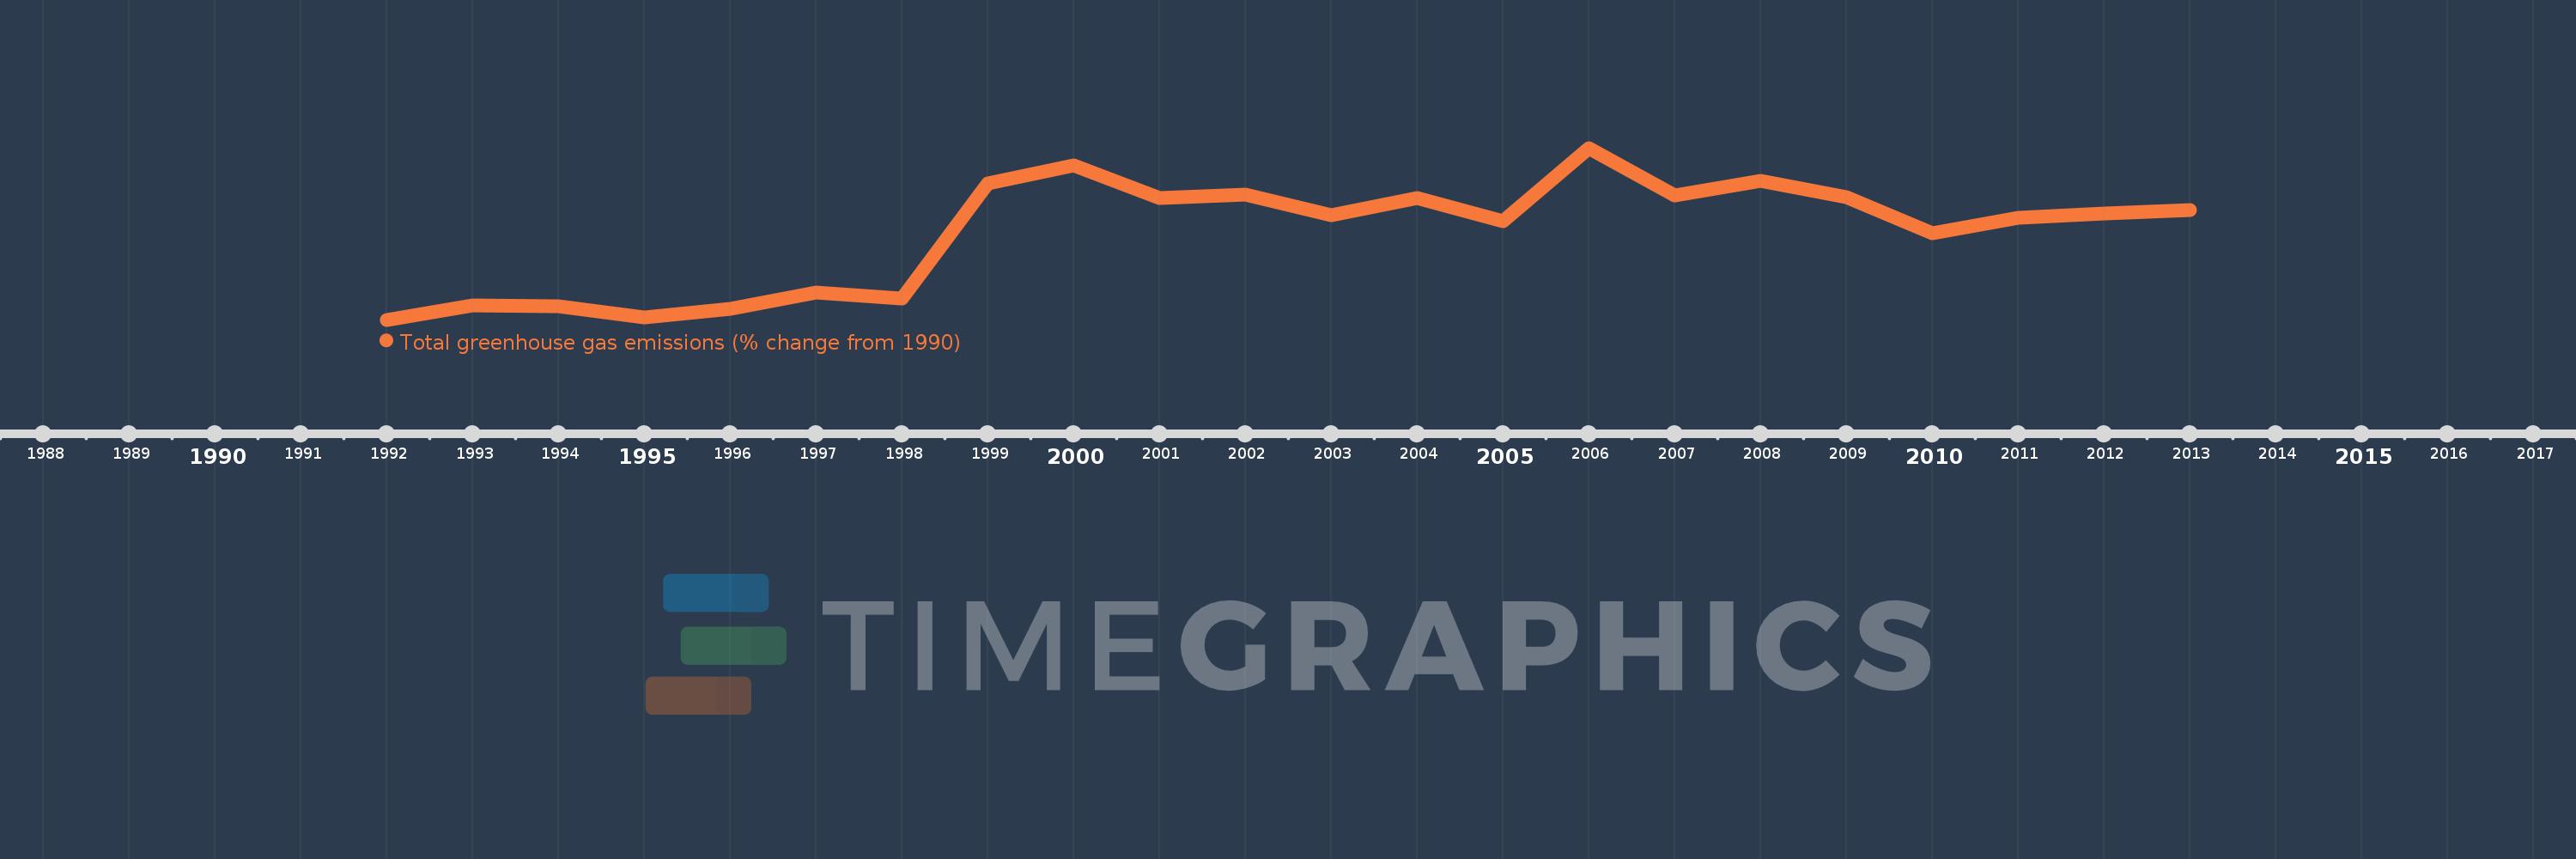
This timeline shows a graph from 1992 to 2013 of Nigeria. No data until 1991. Number of actual observations by date: 22.
Source name:
World Development Indicators
Source organization:
World Bank staff estimates from original source: European Commission, Joint Research Centre (JRC)/Netherlands Environmental Assessment Agency (PBL). Emission Database for Global Atmospheric Research (EDGAR): http://edgar.jrc.ec.europa.eu/.
Categories, topics:
Climate Change, Environment
Last updated:
apr 23, 2017
Indicators value changes by year
Meaning:
67.903
Minimum:
4.923
jan 1, 1992
Maximum:
129.321
jan 1, 2006
At the date of observation
Value
Absolute change
Change from the previous value
jan 1, 1992
4.923
+4.923
0.0%
jan 1, 1993
15.488
+10.565
214.58%
jan 1, 1994
14.907
-0.581
-3.75%
jan 1, 1995
6.881
-8.026
-53.84%
jan 1, 1996
12.722
+5.842
84.9%
jan 1, 1997
24.417
+11.695
91.92%
jan 1, 1998
20.259
-4.158
-17.03%
jan 1, 1999
103.56
+83.301
411.18%
jan 1, 2000
116.509
+12.949
12.5%
jan 1, 2001
92.914
-23.596
-20.25%
jan 1, 2002
95.466
+2.552
2.75%
jan 1, 2003
80.72
-14.747
-15.45%
jan 1, 2004
92.892
+12.172
15.08%
jan 1, 2005
76.48
-16.412
-17.67%
jan 1, 2006
129.321
+52.841
69.09%
jan 1, 2007
95.119
-34.202
-26.45%
jan 1, 2008
105.3
+10.181
10.7%
jan 1, 2009
93.575
-11.724
-11.13%
jan 1, 2010
67.299
-26.276
-28.08%
jan 1, 2011
78.97
+11.671
17.34%
jan 1, 2012
81.78
+2.81
3.56%
jan 1, 2013
84.359
+2.579
3.15%
Ranking of countries by current statistics by years