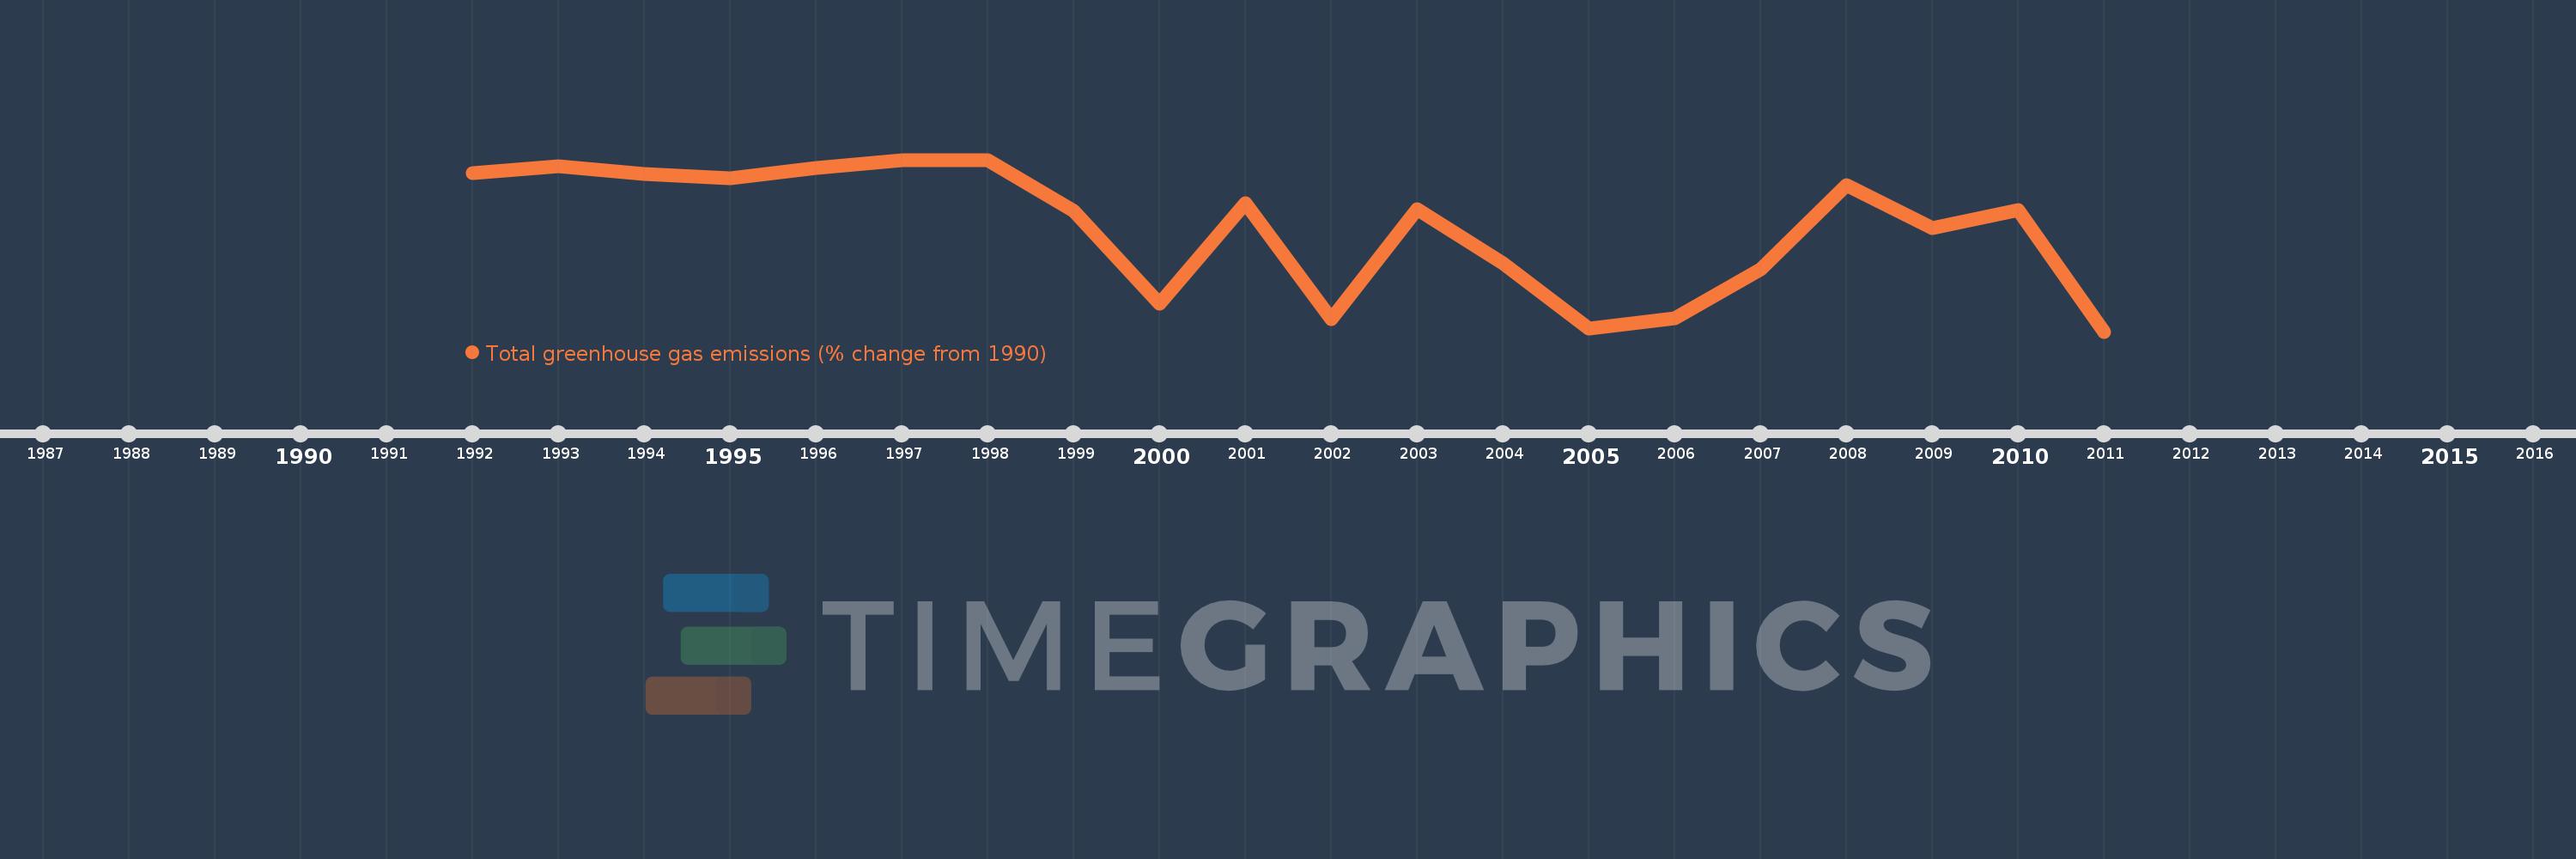
This timeline shows a graph from 1992 to 2011 of Mongolia. No data until 1991. Number of actual observations by date: 20.
Source name:
World Development Indicators
Source organization:
World Bank staff estimates from original source: European Commission, Joint Research Centre (JRC)/Netherlands Environmental Assessment Agency (PBL). Emission Database for Global Atmospheric Research (EDGAR): http://edgar.jrc.ec.europa.eu/.
Categories, topics:
Climate Change, Environment
Last updated:
apr 23, 2017
Indicators value changes by year
Meaning:
-19.837
Minimum:
-57.169
jan 1, 2011
Maximum:
4.687
jan 1, 1997
At the date of observation
Value
Absolute change
Change from the previous value
jan 1, 1992
0.034
+0.034
0.0%
jan 1, 1993
2.502
+2.468
7.32K%
jan 1, 1994
-0.314
-2.815
-112.53%
jan 1, 1995
-1.938
-1.624
518.01%
jan 1, 1996
1.855
+3.793
-195.73%
jan 1, 1997
4.687
+2.832
152.67%
jan 1, 1998
4.682
-0.005
-0.11%
jan 1, 1999
-13.822
-18.504
-395.23%
jan 1, 2000
-47.052
-33.23
240.41%
jan 1, 2001
-10.83
+36.222
-76.98%
jan 1, 2002
-52.619
-41.788
385.85%
jan 1, 2003
-13.015
+39.604
-75.27%
jan 1, 2004
-32.488
-19.473
149.62%
jan 1, 2005
-56.178
-23.69
72.92%
jan 1, 2006
-52.329
+3.848
-6.85%
jan 1, 2007
-34.892
+17.437
-33.32%
jan 1, 2008
-4.547
+30.345
-86.97%
jan 1, 2009
-19.863
-15.316
336.85%
jan 1, 2010
-13.448
+6.415
-32.29%
jan 1, 2011
-57.169
-43.721
325.11%
Ranking of countries by current statistics by years