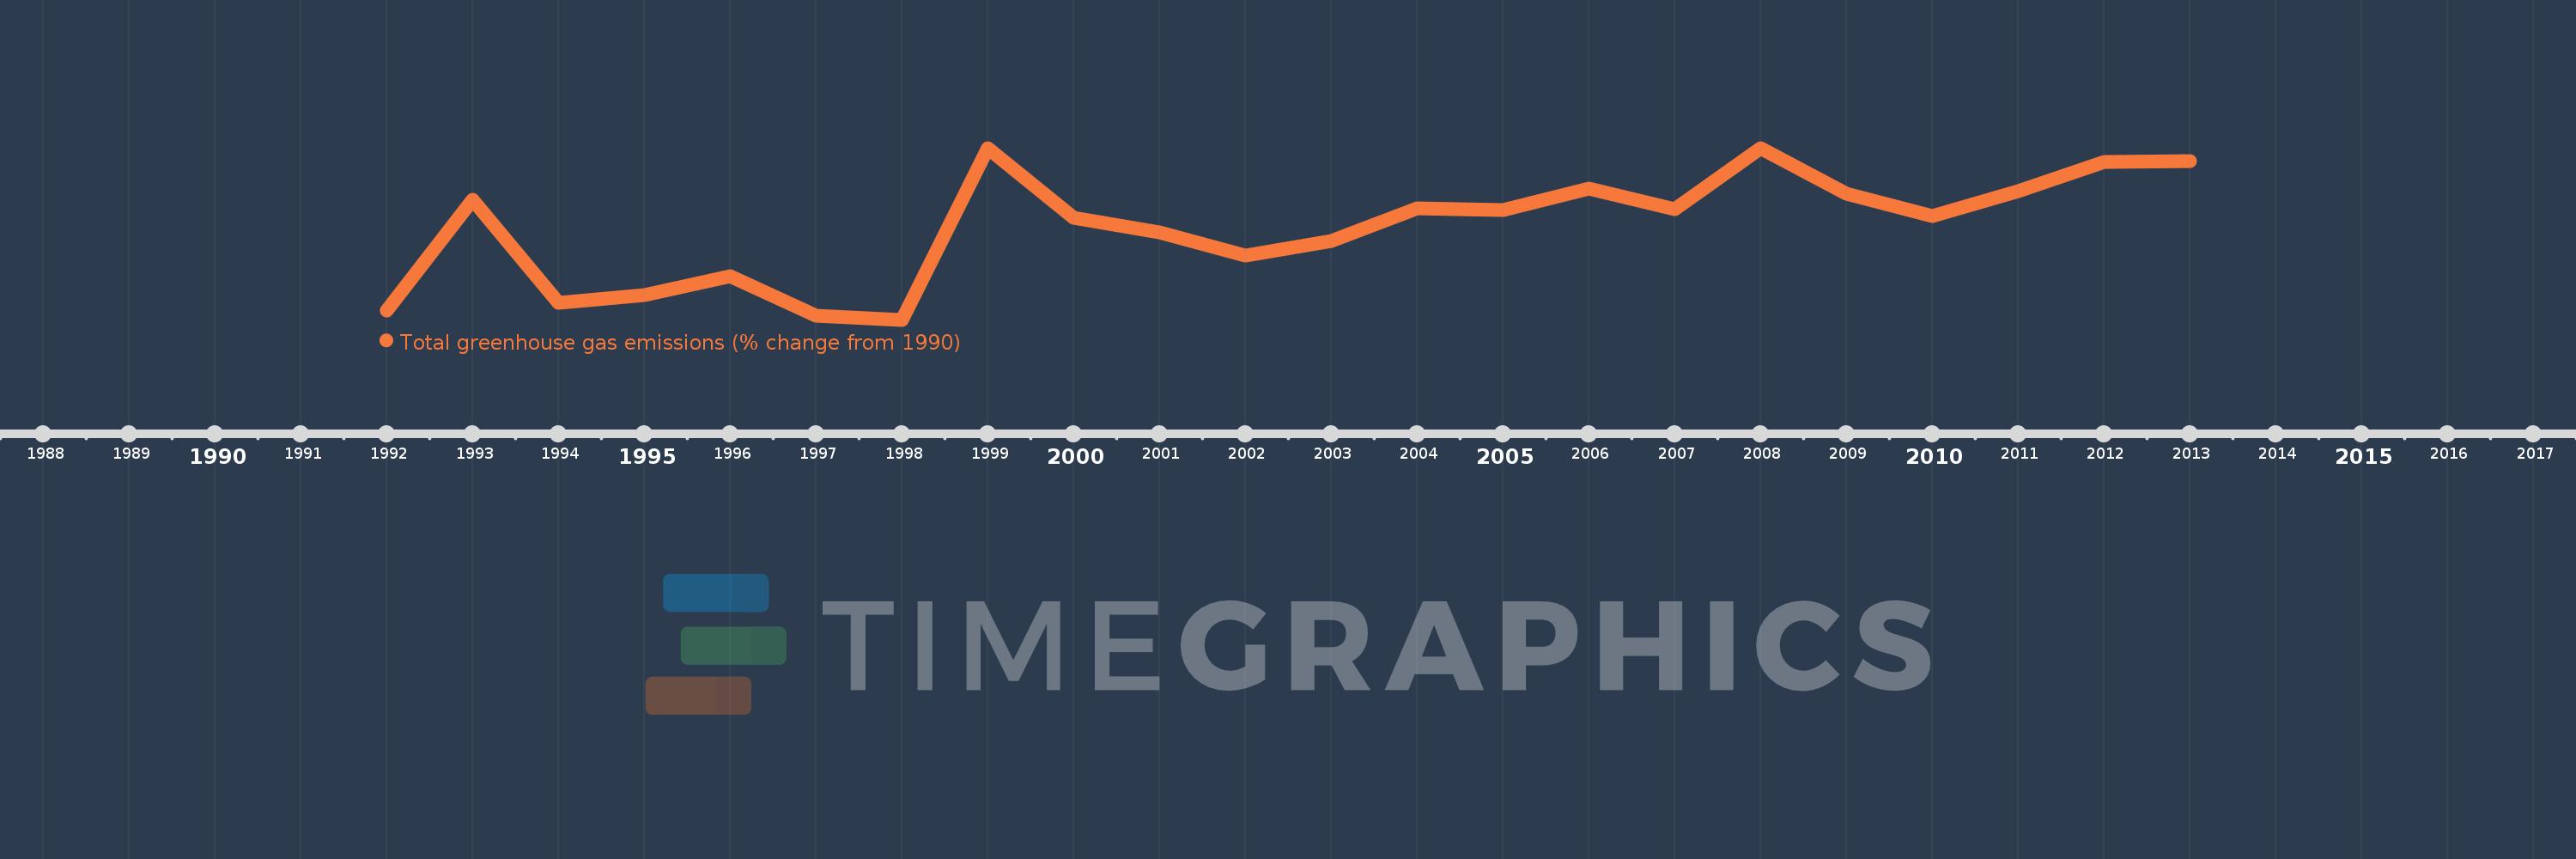
This timeline shows a graph from 1992 to 2013 of IDA only. No data until 1991. Number of actual observations by date: 22.
Source name:
World Development Indicators
Source organization:
World Bank staff estimates from original source: European Commission, Joint Research Centre (JRC)/Netherlands Environmental Assessment Agency (PBL). Emission Database for Global Atmospheric Research (EDGAR): http://edgar.jrc.ec.europa.eu/.
Categories, topics:
Climate Change, Environment
Last updated:
apr 23, 2017
Indicators value changes by year
Meaning:
12.394
Minimum:
-16.271
jan 1, 1998
Maximum:
37.094
jan 1, 2008
At the date of observation
Value
Absolute change
Change from the previous value
jan 1, 1992
-13.316
-13.316
0.0%
jan 1, 1993
21.033
+34.349
-257.95%
jan 1, 1994
-11.141
-32.174
-152.97%
jan 1, 1995
-8.693
+2.448
-21.97%
jan 1, 1996
-2.811
+5.882
-67.66%
jan 1, 1997
-15.028
-12.217
434.63%
jan 1, 1998
-16.271
-1.243
8.27%
jan 1, 1999
36.896
+53.167
-326.76%
jan 1, 2000
15.333
-21.563
-58.44%
jan 1, 2001
10.955
-4.378
-28.55%
jan 1, 2002
3.715
-7.24
-66.09%
jan 1, 2003
8.074
+4.359
117.33%
jan 1, 2004
18.259
+10.185
126.15%
jan 1, 2005
17.855
-0.404
-2.21%
jan 1, 2006
24.38
+6.525
36.55%
jan 1, 2007
18.076
-6.304
-25.86%
jan 1, 2008
37.094
+19.019
105.22%
jan 1, 2009
22.852
-14.243
-38.4%
jan 1, 2010
15.876
-6.976
-30.53%
jan 1, 2011
23.707
+7.831
49.33%
jan 1, 2012
32.752
+9.046
38.16%
jan 1, 2013
33.073
+0.321
0.98%
Ranking of countries by current statistics by years