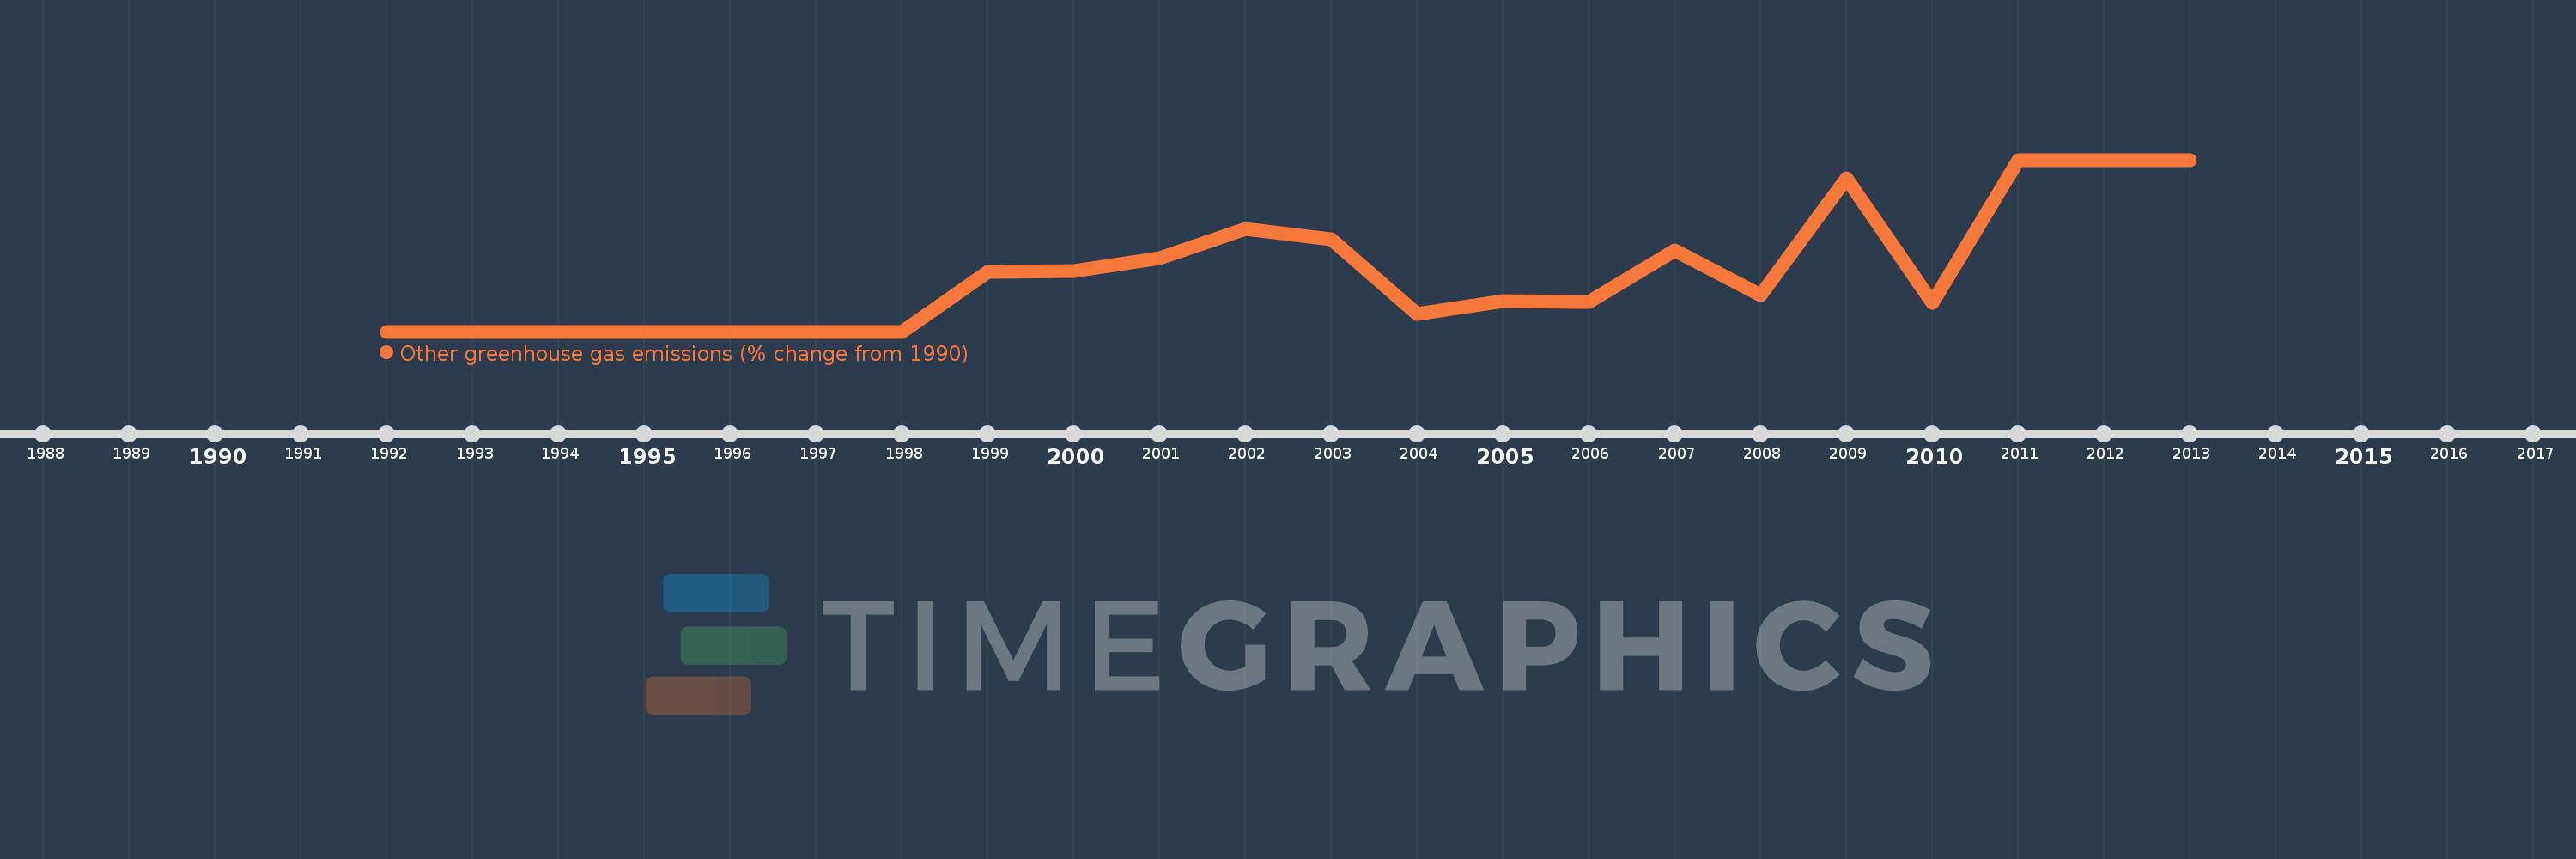
This timeline shows a graph from 1992 to 2013 of Botswana. No data until 1991. Number of actual observations by date: 22.
Source name:
World Development Indicators
Source organization:
World Bank staff estimates from original source: European Commission, Joint Research Centre (JRC)/Netherlands Environmental Assessment Agency (PBL). Emission Database for Global Atmospheric Research (EDGAR): http://edgar.jrc.ec.europa.eu/.
Categories, topics:
Climate Change, Environment
Last updated:
apr 23, 2017
Indicators value changes by year
Meaning:
5.924K
Minimum:
0.0
jan 1, 1993
Maximum:
17.481K
jan 1, 2011
At the date of observation
Value
Absolute change
Change from the previous value
jan 1, 1992
0.0
+0.0
0.0%
jan 1, 1993
0.0
0.0
-50.0%
jan 1, 1994
0.0
+0.0
100.0%
jan 1, 1995
0.0
0.0
0.0%
jan 1, 1996
0.0
0.0
0.0%
jan 1, 1997
0.0
0.0
-50.0%
jan 1, 1998
0.0
+0.0
100.0%
jan 1, 1999
6.092K
+6.092K
1247154.21 trl%
jan 1, 2000
6.142K
+49.575
0.81%
jan 1, 2001
7.5K
+1.358K
22.1%
jan 1, 2002
10.443K
+2.943K
39.25%
jan 1, 2003
9.355K
-1.088K
-10.41%
jan 1, 2004
1.791K
-7.564K
-80.85%
jan 1, 2005
3.098K
+1.307K
72.96%
jan 1, 2006
2.991K
-106.9
-3.45%
jan 1, 2007
8.255K
+5.264K
175.98%
jan 1, 2008
3.7K
-4.555K
-55.18%
jan 1, 2009
15.579K
+11.879K
321.03%
jan 1, 2010
2.94K
-12.639K
-81.13%
jan 1, 2011
17.481K
+14.542K
494.66%
jan 1, 2012
17.481K
0.0
0.0%
jan 1, 2013
17.481K
0.0
0.0%
Ranking of countries by current statistics by years