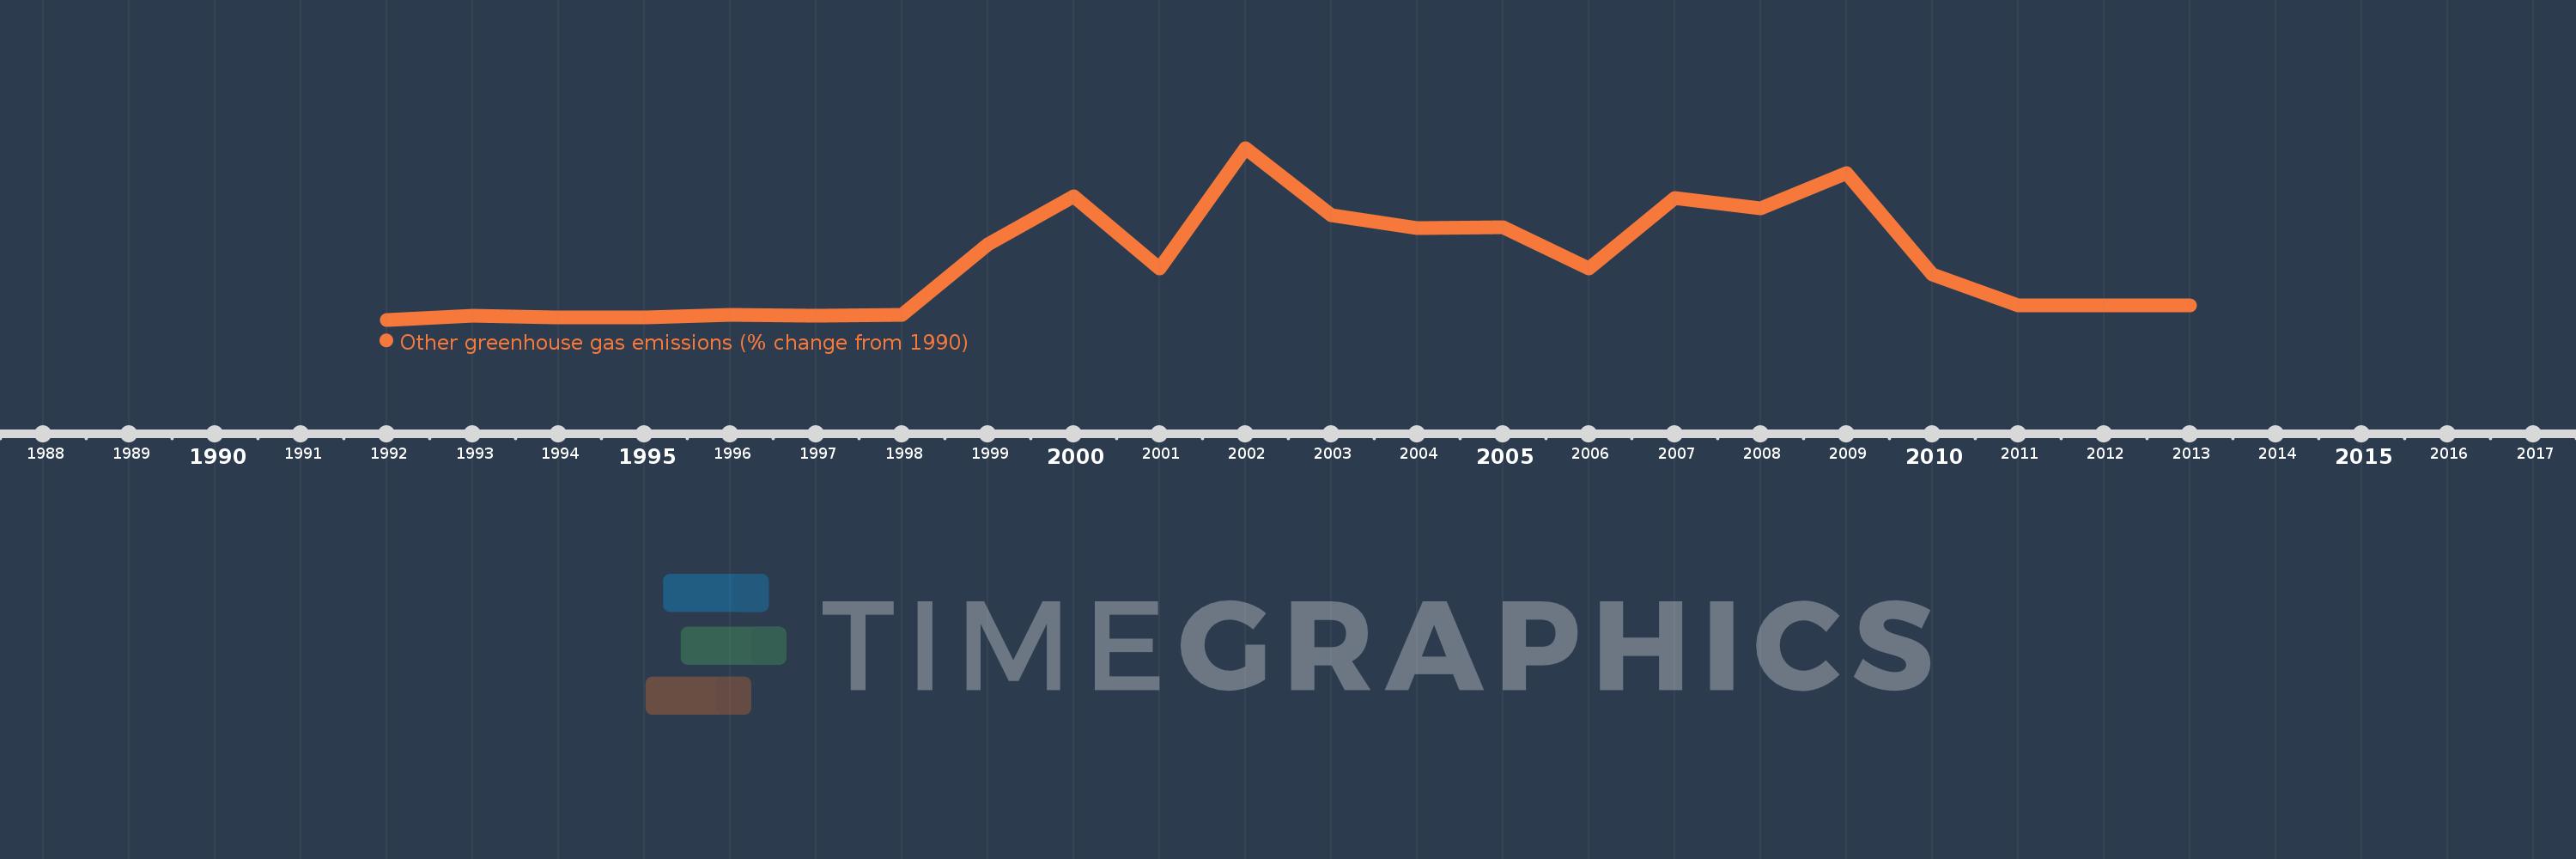
This timeline shows a graph from 1992 to 2013 of Sierra Leone. No data until 1991. Number of actual observations by date: 22.
Source name:
World Development Indicators
Source organization:
World Bank staff estimates from original source: European Commission, Joint Research Centre (JRC)/Netherlands Environmental Assessment Agency (PBL). Emission Database for Global Atmospheric Research (EDGAR): http://edgar.jrc.ec.europa.eu/.
Categories, topics:
Climate Change, Environment
Last updated:
apr 23, 2017
Indicators value changes by year
Meaning:
149.934
Minimum:
-18.607
jan 1, 1992
Maximum:
489.565
jan 1, 2002
At the date of observation
Value
Absolute change
Change from the previous value
jan 1, 1992
-18.607
-18.607
0.0%
jan 1, 1993
-6.429
+12.178
-65.45%
jan 1, 1994
-12.482
-6.053
94.15%
jan 1, 1995
-12.789
-0.308
2.46%
jan 1, 1996
-3.843
+8.947
-69.96%
jan 1, 1997
-6.164
-2.321
60.41%
jan 1, 1998
-4.391
+1.773
-28.77%
jan 1, 1999
205.052
+209.443
-4.77K%
jan 1, 2000
346.24
+141.188
68.85%
jan 1, 2001
133.899
-212.341
-61.33%
jan 1, 2002
489.565
+355.666
265.62%
jan 1, 2003
290.295
-199.27
-40.7%
jan 1, 2004
251.274
-39.021
-13.44%
jan 1, 2005
255.131
+3.857
1.54%
jan 1, 2006
133.516
-121.615
-47.67%
jan 1, 2007
342.304
+208.788
156.38%
jan 1, 2008
310.365
-31.939
-9.33%
jan 1, 2009
416.146
+105.781
34.08%
jan 1, 2010
115.858
-300.288
-72.16%
jan 1, 2011
24.538
-91.32
-78.82%
jan 1, 2012
24.538
0.0
0.0%
jan 1, 2013
24.538
0.0
0.0%
Ranking of countries by current statistics by years