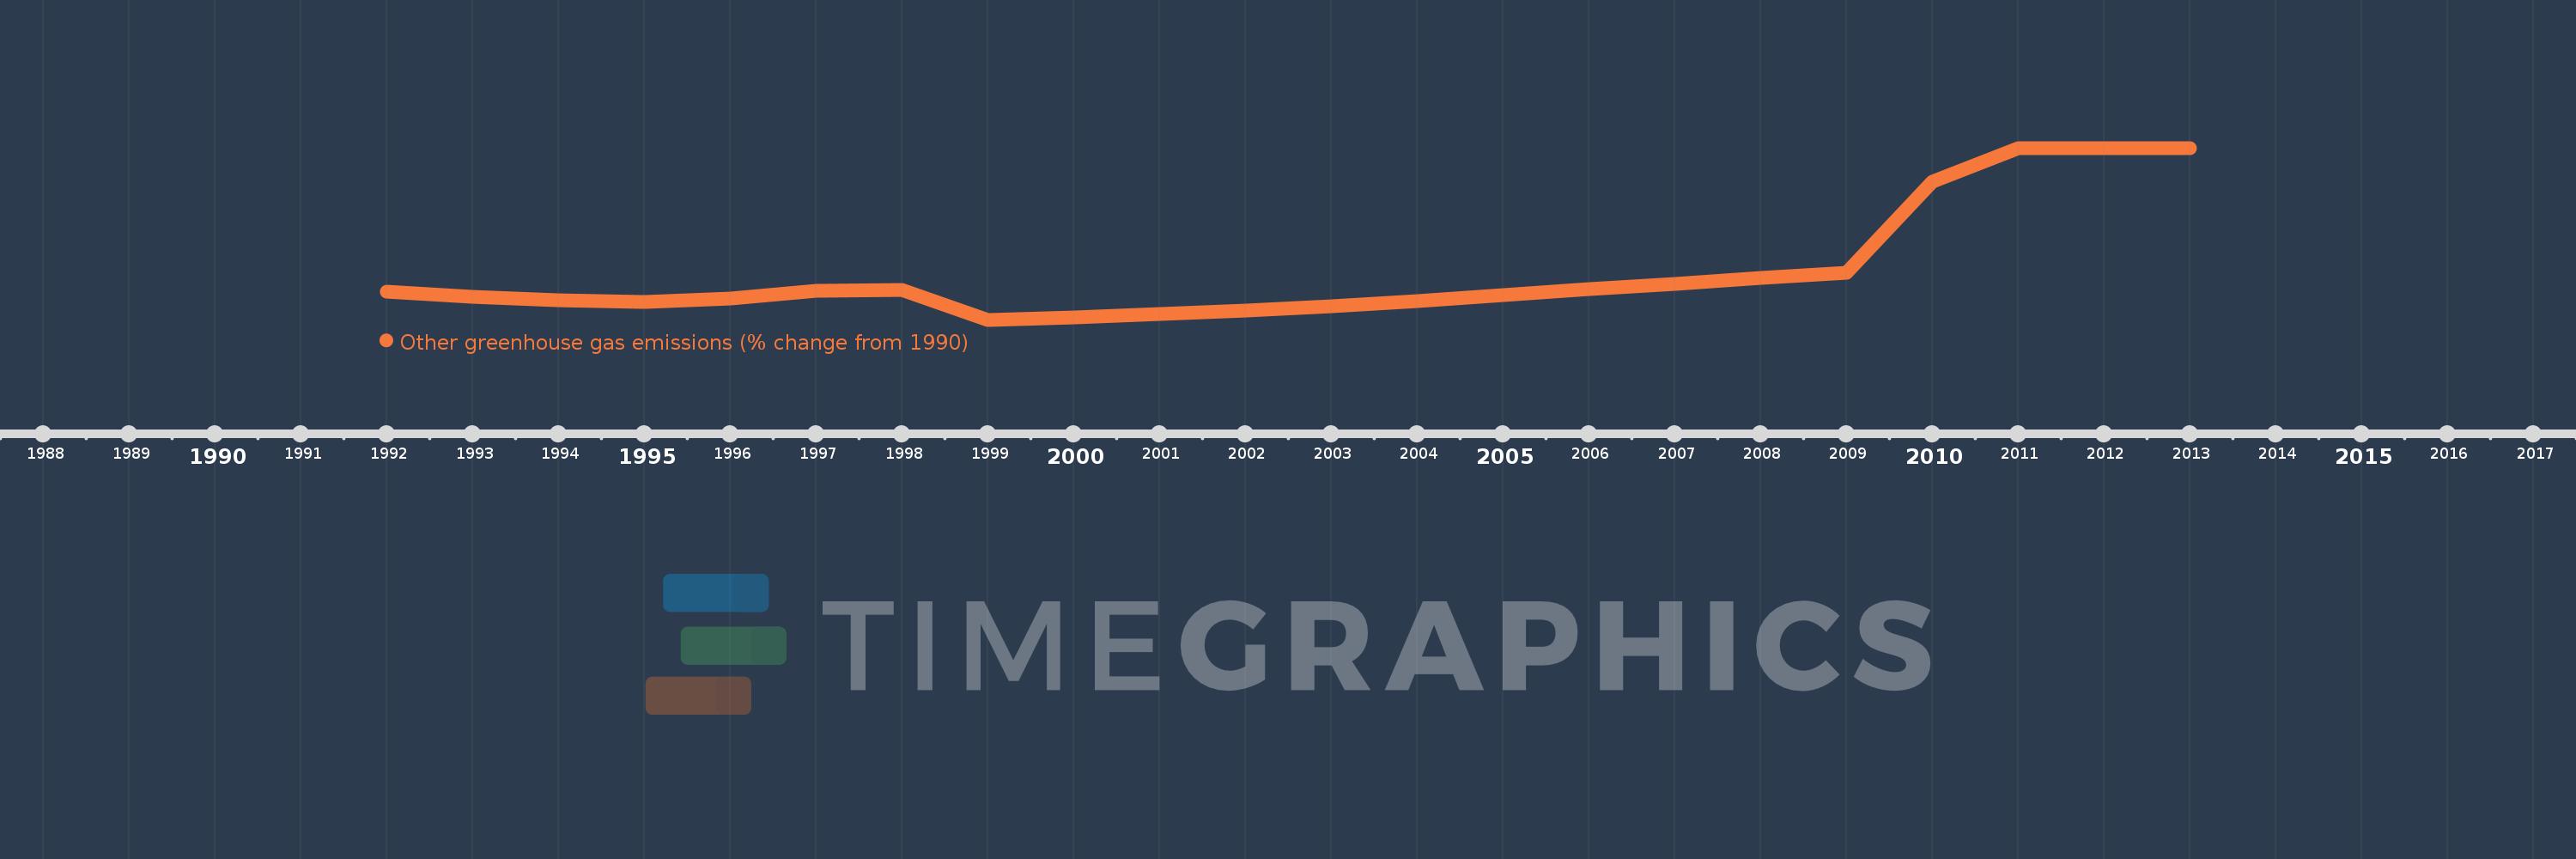
This timeline shows a graph from 1992 to 2013 of Slovak Republic. No data until 1991. Number of actual observations by date: 22.
Source name:
World Development Indicators
Source organization:
World Bank staff estimates from original source: European Commission, Joint Research Centre (JRC)/Netherlands Environmental Assessment Agency (PBL). Emission Database for Global Atmospheric Research (EDGAR): http://edgar.jrc.ec.europa.eu/.
Categories, topics:
Climate Change, Environment
Last updated:
apr 23, 2017
Indicators value changes by year
Meaning:
52.561
Minimum:
-61.121
jan 1, 1999
Maximum:
347.089
jan 1, 2012
At the date of observation
Value
Absolute change
Change from the previous value
jan 1, 1992
6.403
+6.403
0.0%
jan 1, 1993
-5.934
-12.337
-192.67%
jan 1, 1994
-14.489
-8.555
144.17%
jan 1, 1995
-18.428
-3.939
27.19%
jan 1, 1996
-11.256
+7.173
-38.92%
jan 1, 1997
8.646
+19.902
-176.81%
jan 1, 1998
10.713
+2.067
23.9%
jan 1, 1999
-61.121
-71.834
-670.55%
jan 1, 2000
-55.782
+5.339
-8.74%
jan 1, 2001
-47.376
+8.406
-15.07%
jan 1, 2002
-39.791
+7.585
-16.01%
jan 1, 2003
-28.899
+10.892
-27.37%
jan 1, 2004
-17.231
+11.668
-40.38%
jan 1, 2005
-1.656
+15.575
-90.39%
jan 1, 2006
11.789
+13.445
-811.73%
jan 1, 2007
24.9
+13.111
111.21%
jan 1, 2008
38.162
+13.262
53.26%
jan 1, 2009
50.386
+12.223
32.03%
jan 1, 2010
266.045
+215.66
428.02%
jan 1, 2011
347.089
+81.044
30.46%
jan 1, 2012
347.089
+0.0
0.0%
jan 1, 2013
347.089
0.0
0.0%
Ranking of countries by current statistics by years