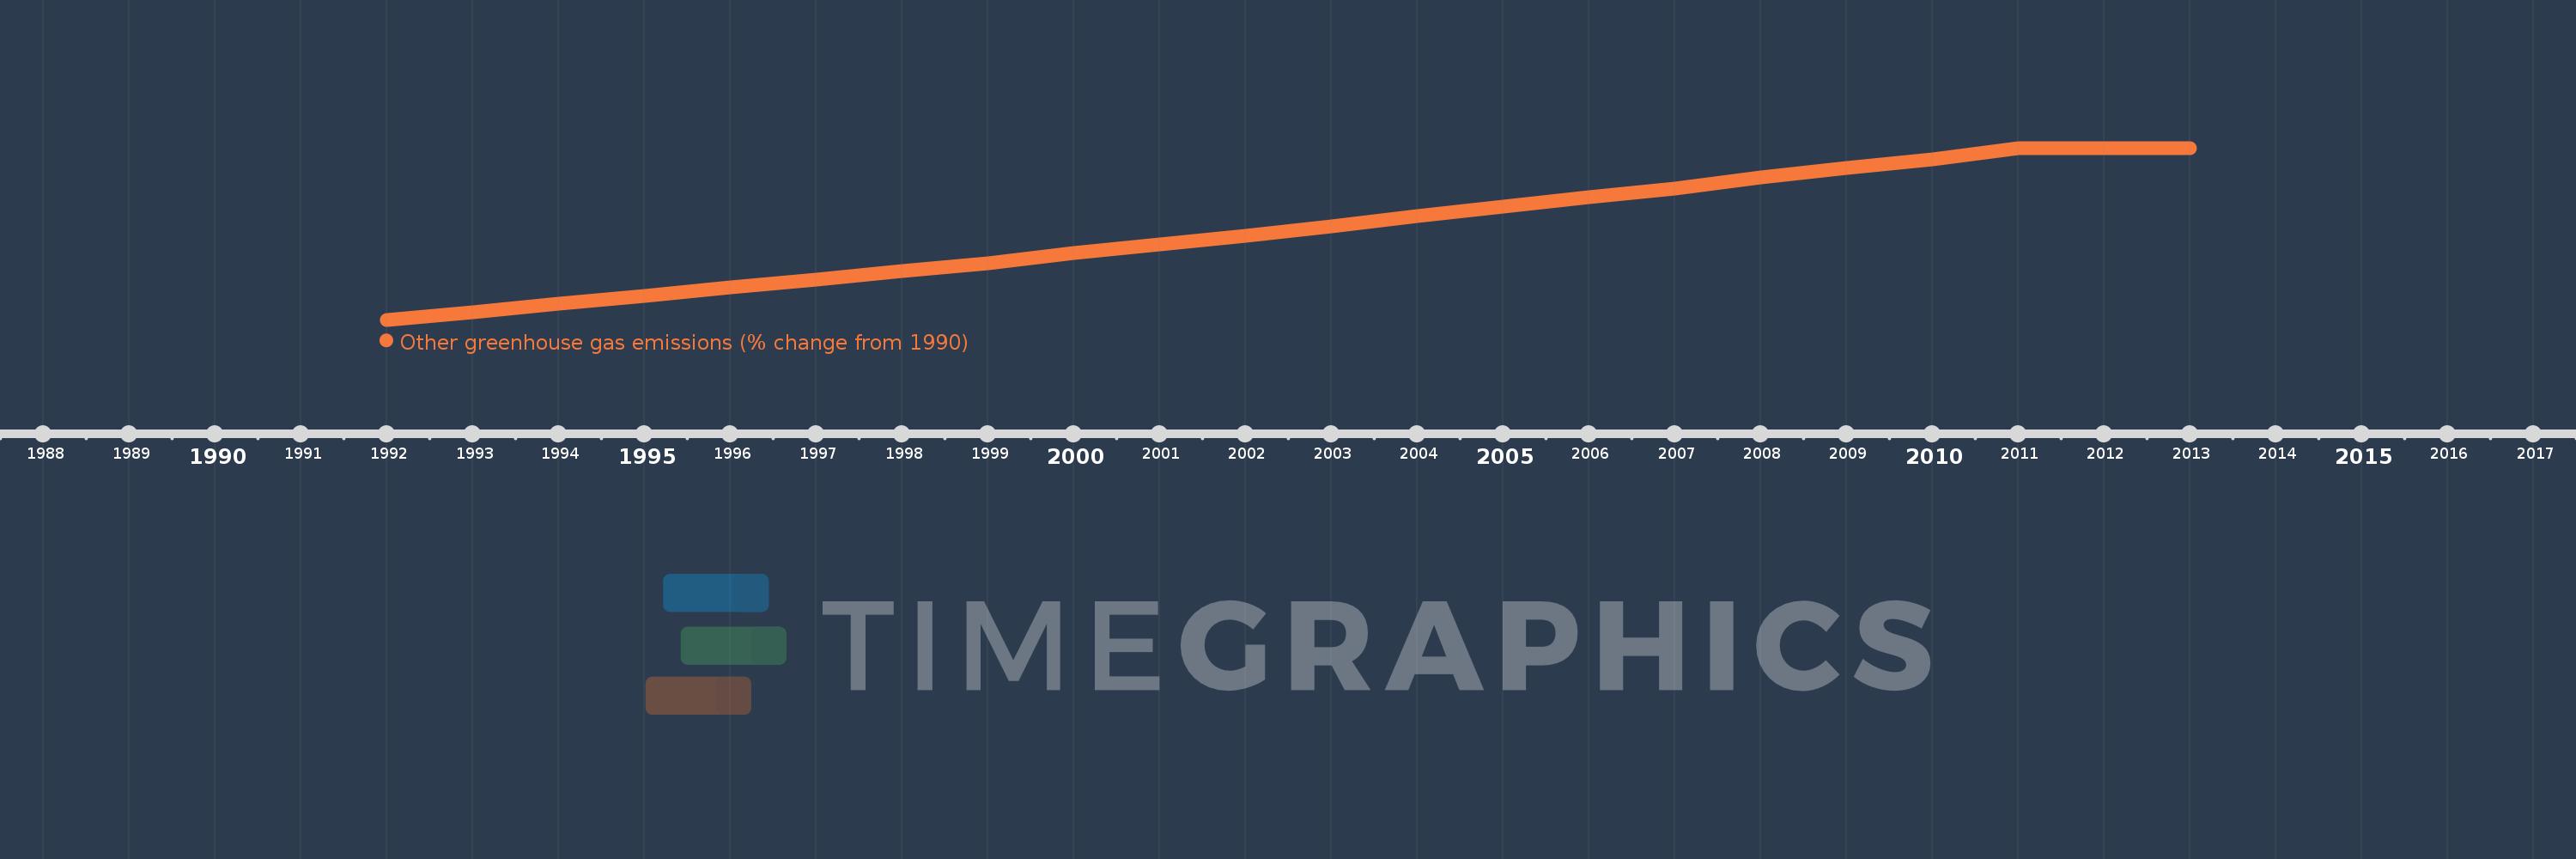
This timeline shows a graph from 1992 to 2013 of Grenada. No data until 1991. Number of actual observations by date: 22.
Source name:
World Development Indicators
Source organization:
World Bank staff estimates from original source: European Commission, Joint Research Centre (JRC)/Netherlands Environmental Assessment Agency (PBL). Emission Database for Global Atmospheric Research (EDGAR): http://edgar.jrc.ec.europa.eu/.
Categories, topics:
Climate Change, Environment
Last updated:
apr 23, 2017
Indicators value changes by year
Meaning:
27.324
Minimum:
1.908
jan 1, 1992
Maximum:
50.281
jan 1, 2011
At the date of observation
Value
Absolute change
Change from the previous value
jan 1, 1992
1.908
+1.908
0.0%
jan 1, 1993
4.04
+2.132
111.76%
jan 1, 1994
6.453
+2.413
59.72%
jan 1, 1995
8.642
+2.189
33.91%
jan 1, 1996
11.055
+2.413
27.92%
jan 1, 1997
13.3
+2.245
20.3%
jan 1, 1998
15.657
+2.357
17.72%
jan 1, 1999
17.901
+2.245
14.34%
jan 1, 2000
20.763
+2.862
15.99%
jan 1, 2001
23.008
+2.245
10.81%
jan 1, 2002
25.477
+2.469
10.73%
jan 1, 2003
28.171
+2.694
10.57%
jan 1, 2004
31.145
+2.974
10.56%
jan 1, 2005
33.838
+2.694
8.65%
jan 1, 2006
36.308
+2.469
7.3%
jan 1, 2007
38.889
+2.581
7.11%
jan 1, 2008
42.031
+3.143
8.08%
jan 1, 2009
44.557
+2.525
6.01%
jan 1, 2010
47.138
+2.581
5.79%
jan 1, 2011
50.281
+3.143
6.67%
jan 1, 2012
50.281
0.0
0.0%
jan 1, 2013
50.281
+0.0
0.0%
Ranking of countries by current statistics by years