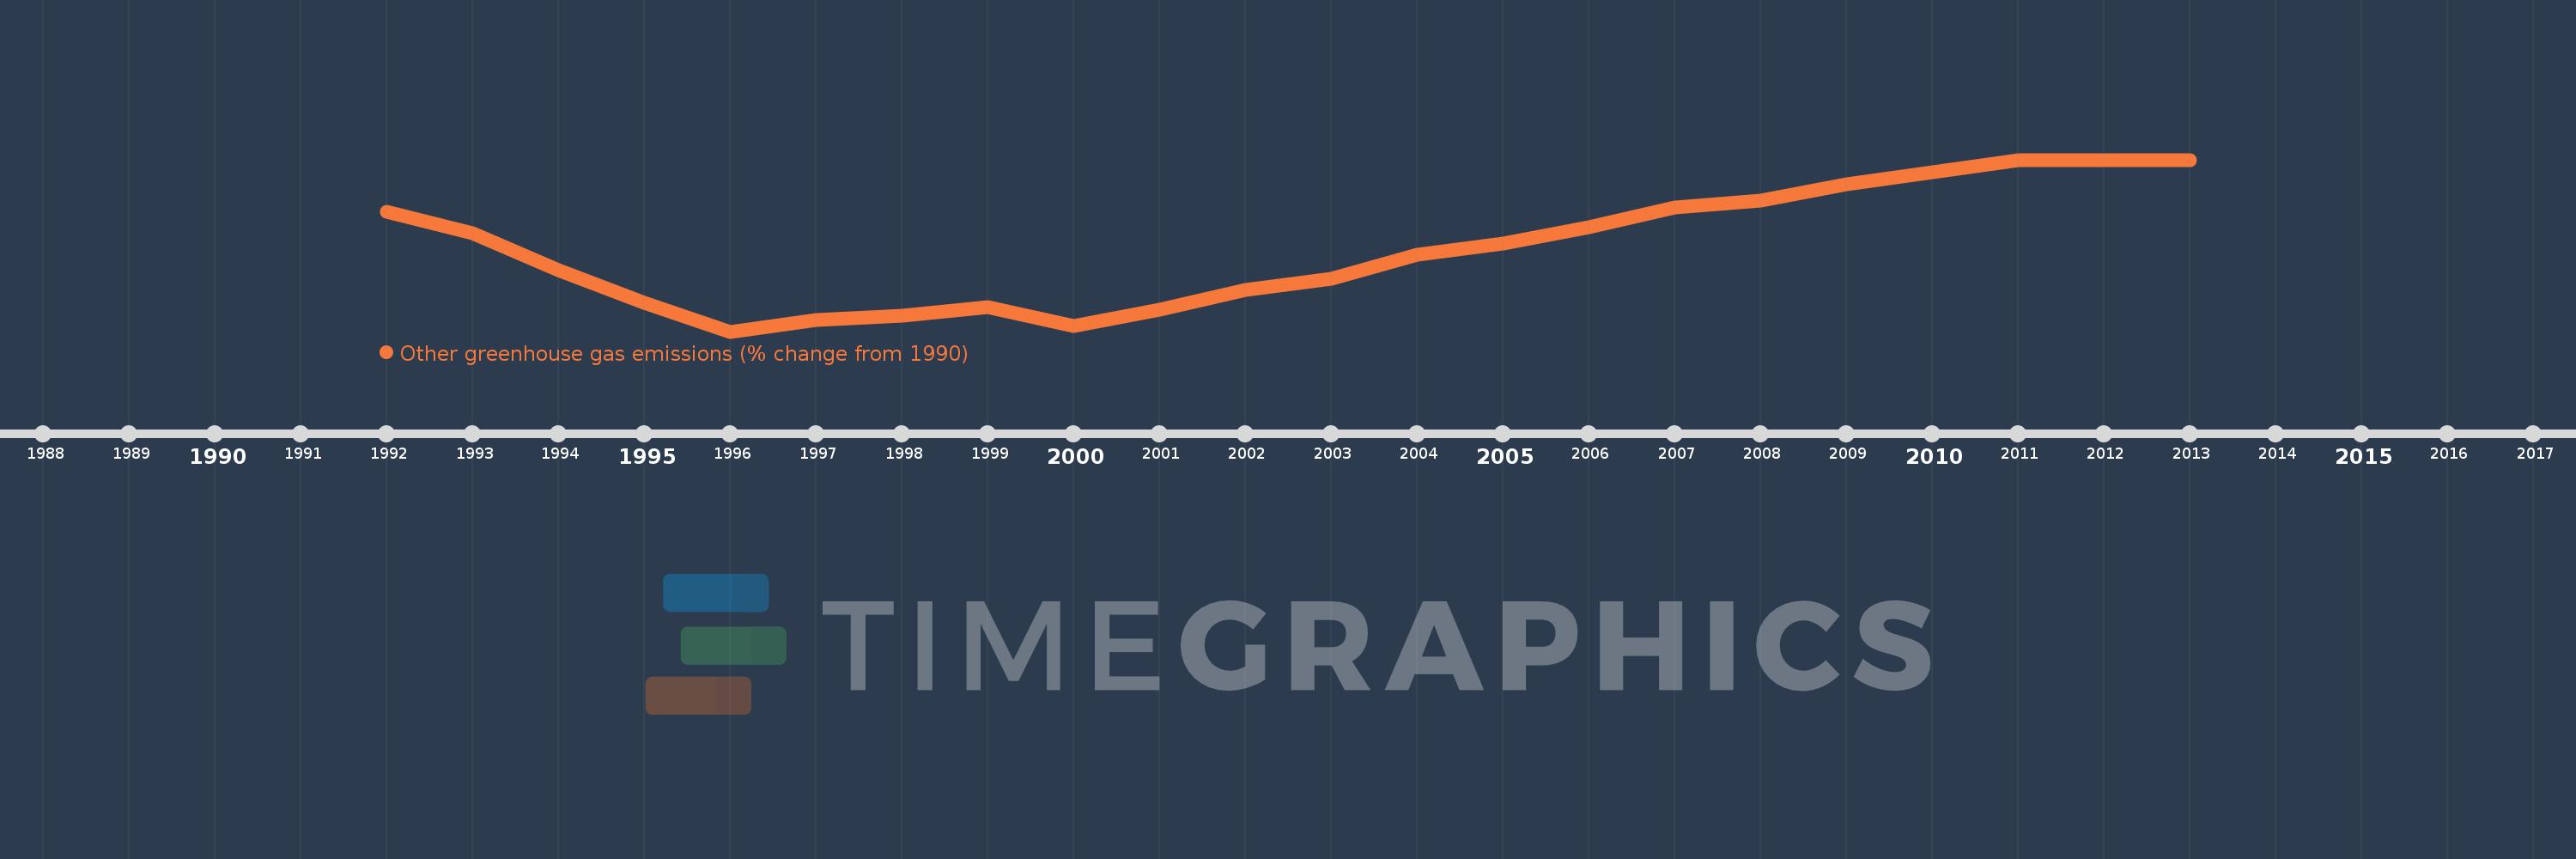
This timeline shows a graph from 1992 to 2013 of Libya. No data until 1991. Number of actual observations by date: 22.
Source name:
World Development Indicators
Source organization:
World Bank staff estimates from original source: European Commission, Joint Research Centre (JRC)/Netherlands Environmental Assessment Agency (PBL). Emission Database for Global Atmospheric Research (EDGAR): http://edgar.jrc.ec.europa.eu/.
Categories, topics:
Climate Change, Environment
Last updated:
apr 23, 2017
Indicators value changes by year
Meaning:
-19.404
Minimum:
-52.05
jan 1, 1996
Maximum:
15.457
jan 1, 2013
At the date of observation
Value
Absolute change
Change from the previous value
jan 1, 1992
-5.047
-5.047
0.0%
jan 1, 1993
-13.565
-8.517
168.75%
jan 1, 1994
-28.076
-14.511
106.98%
jan 1, 1995
-40.694
-12.618
44.94%
jan 1, 1996
-52.05
-11.356
27.91%
jan 1, 1997
-47.634
+4.416
-8.48%
jan 1, 1998
-45.741
+1.893
-3.97%
jan 1, 1999
-42.271
+3.47
-7.59%
jan 1, 2000
-49.842
-7.571
17.91%
jan 1, 2001
-43.533
+6.309
-12.66%
jan 1, 2002
-35.647
+7.886
-18.12%
jan 1, 2003
-31.23
+4.416
-12.39%
jan 1, 2004
-21.764
+9.466
-30.31%
jan 1, 2005
-17.429
+4.335
-19.92%
jan 1, 2006
-11.041
+6.388
-36.65%
jan 1, 2007
-3.155
+7.886
-71.43%
jan 1, 2008
-0.631
+2.524
-80.0%
jan 1, 2009
5.678
+6.309
-1000.0%
jan 1, 2010
10.41
+4.732
83.33%
jan 1, 2011
15.457
+5.047
48.48%
jan 1, 2012
15.457
+0.0
0.0%
jan 1, 2013
15.457
+0.0
0.0%
Ranking of countries by current statistics by years