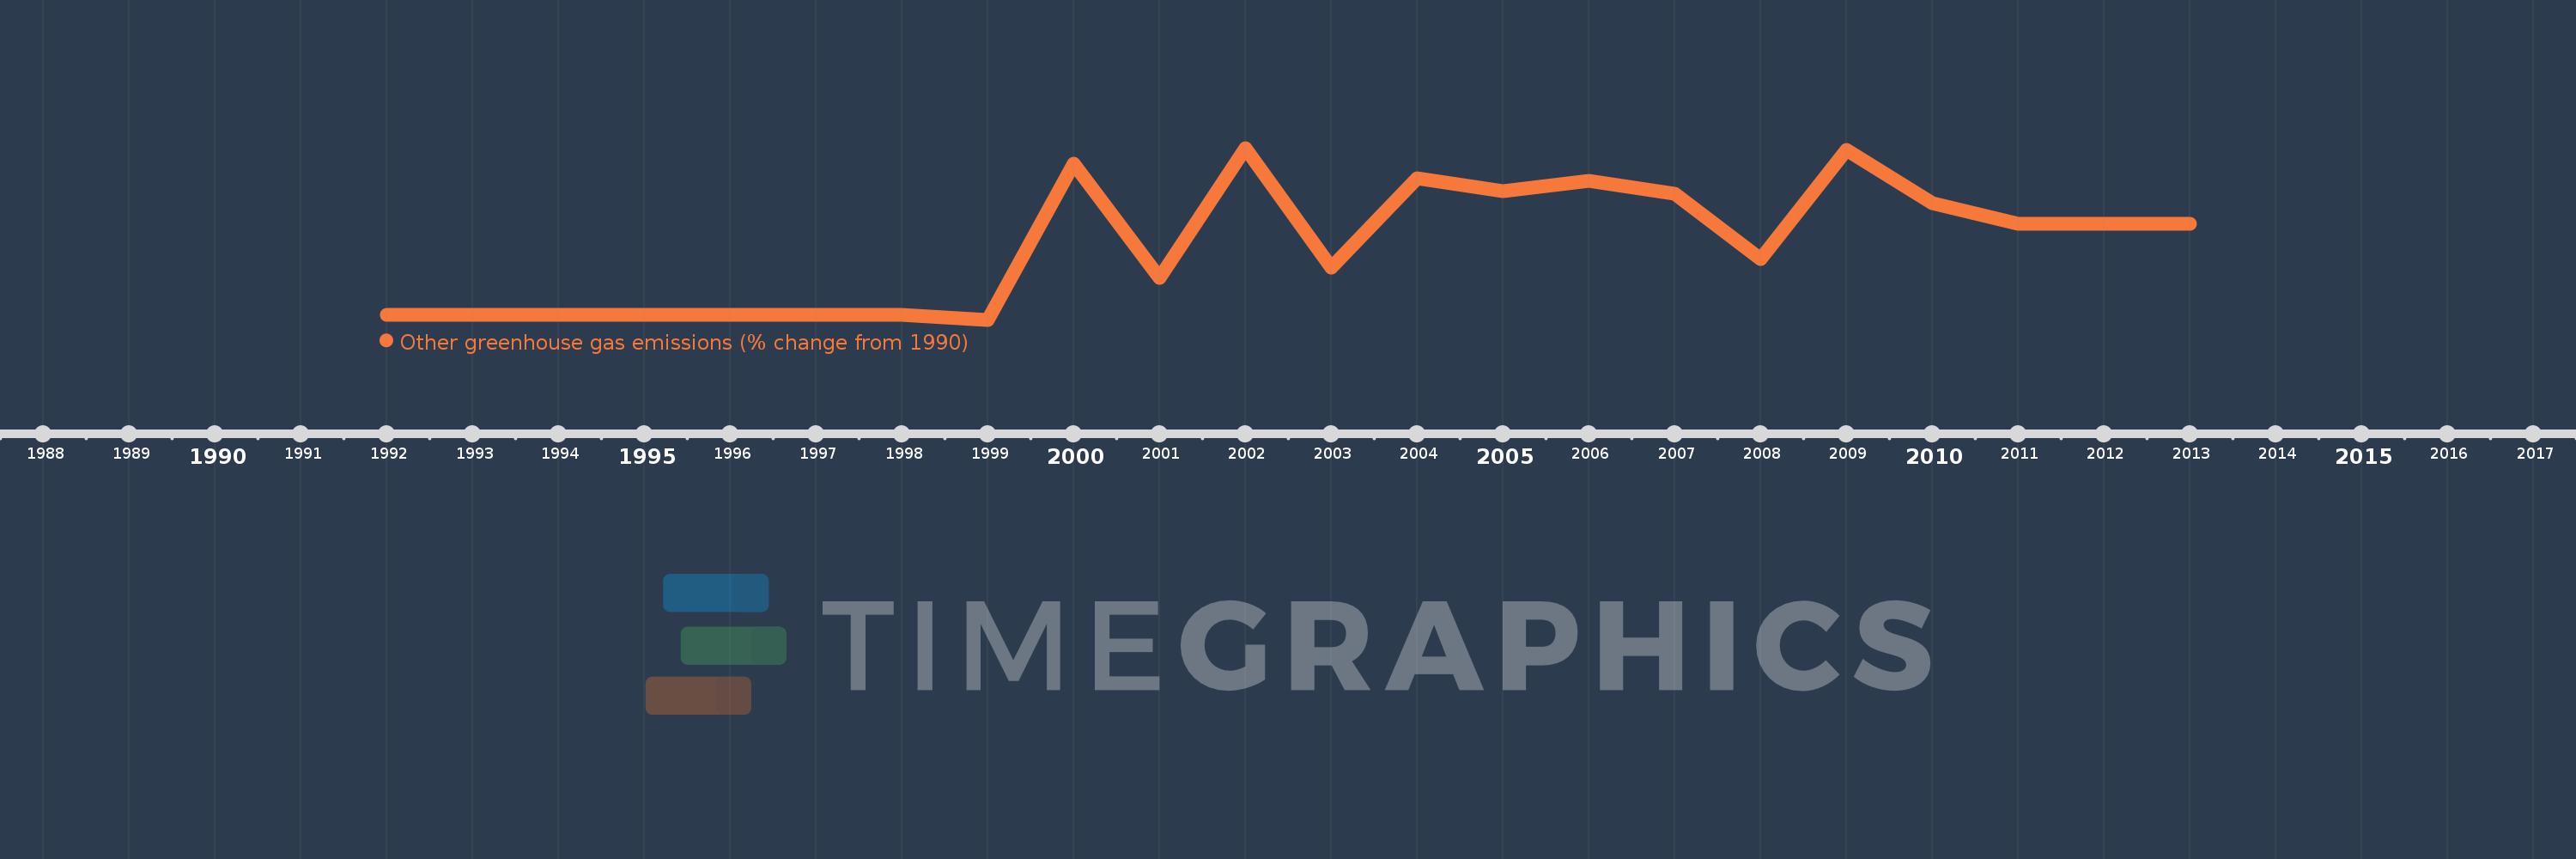
This timeline shows a graph from 1992 to 2013 of Haiti. No data until 1991. Number of actual observations by date: 22.
Source name:
World Development Indicators
Source organization:
World Bank staff estimates from original source: European Commission, Joint Research Centre (JRC)/Netherlands Environmental Assessment Agency (PBL). Emission Database for Global Atmospheric Research (EDGAR): http://edgar.jrc.ec.europa.eu/.
Categories, topics:
Climate Change, Environment
Last updated:
apr 23, 2017
Indicators value changes by year
Meaning:
1.474K
Minimum:
-100.0
jan 1, 1999
Maximum:
3.562K
jan 1, 2002
At the date of observation
Value
Absolute change
Change from the previous value
jan 1, 1992
-0.556
-0.556
0.0%
jan 1, 1993
-1.111
-0.555
100.0%
jan 1, 1994
-1.667
-0.556
50.02%
jan 1, 1995
-2.222
-0.556
33.33%
jan 1, 1996
-2.778
-0.555
25.0%
jan 1, 1997
-3.333
-0.556
20.0%
jan 1, 1998
-3.889
-0.556
16.67%
jan 1, 1999
-100.0
-96.111
2.47K%
jan 1, 2000
3.226K
+3.326K
-3.33K%
jan 1, 2001
793.402
-2.433K
-75.41%
jan 1, 2002
3.562K
+2.769K
348.99%
jan 1, 2003
1.011K
-2.552K
-71.63%
jan 1, 2004
2.919K
+1.909K
188.82%
jan 1, 2005
2.643K
-276.65
-9.48%
jan 1, 2006
2.859K
+216.575
8.2%
jan 1, 2007
2.584K
-274.975
-9.62%
jan 1, 2008
1.203K
-1.381K
-53.44%
jan 1, 2009
3.512K
+2.309K
191.9%
jan 1, 2010
2.385K
-1.127K
-32.1%
jan 1, 2011
1.952K
-433.325
-18.17%
jan 1, 2012
1.952K
+0.0
0.0%
jan 1, 2013
1.952K
0.0
0.0%
Ranking of countries by current statistics by years