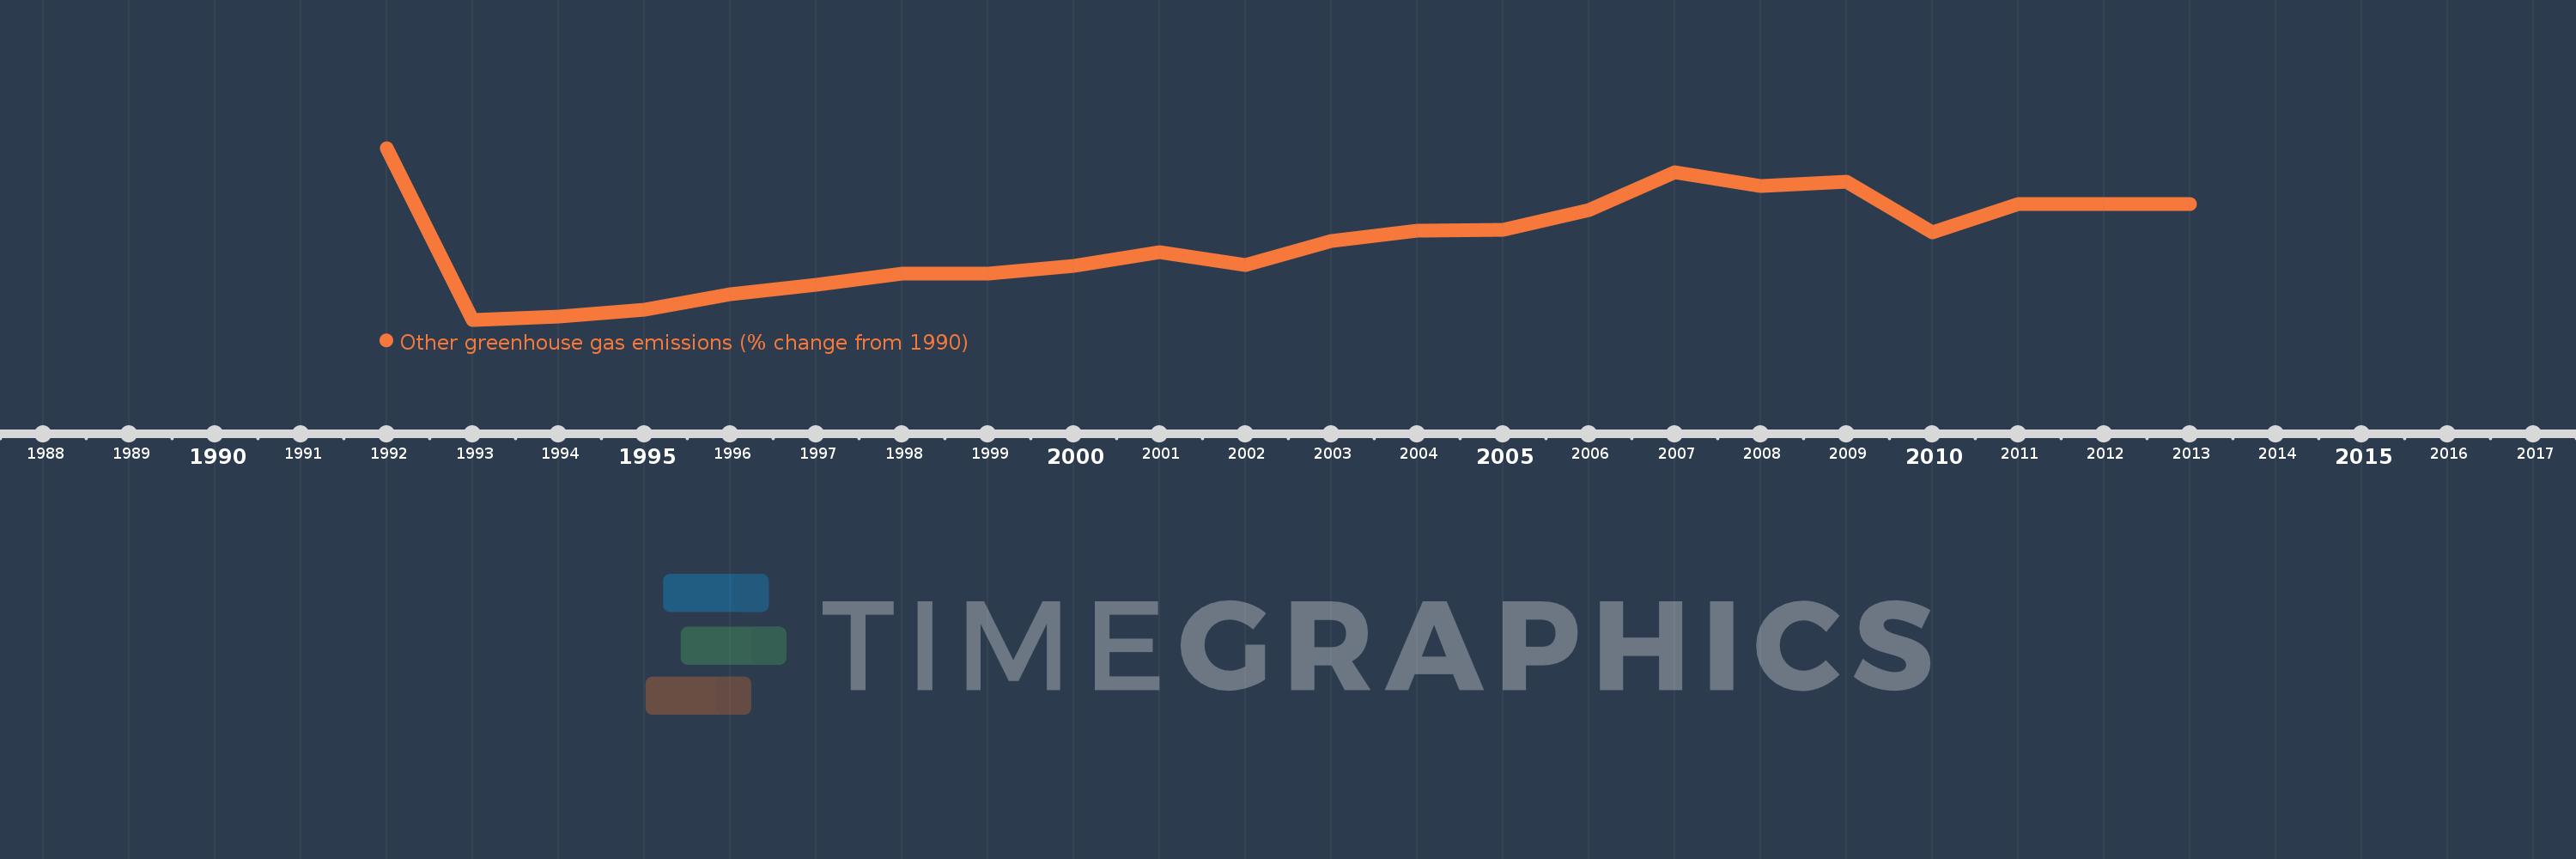
This timeline shows a graph from 1992 to 2013 of Sweden. No data until 1991. Number of actual observations by date: 22.
Source name:
World Development Indicators
Source organization:
World Bank staff estimates from original source: European Commission, Joint Research Centre (JRC)/Netherlands Environmental Assessment Agency (PBL). Emission Database for Global Atmospheric Research (EDGAR): http://edgar.jrc.ec.europa.eu/.
Categories, topics:
Climate Change, Environment
Last updated:
apr 23, 2017
Indicators value changes by year
Meaning:
54.775
Minimum:
-12.183
jan 1, 1993
Maximum:
133.534
jan 1, 1992
At the date of observation
Value
Absolute change
Change from the previous value
jan 1, 1992
133.534
+133.534
0.0%
jan 1, 1993
-12.183
-145.717
-109.12%
jan 1, 1994
-9.239
+2.944
-24.16%
jan 1, 1995
-3.337
+5.902
-63.88%
jan 1, 1996
9.338
+12.676
-379.82%
jan 1, 1997
17.69
+8.352
89.44%
jan 1, 1998
26.703
+9.013
50.95%
jan 1, 1999
27.244
+0.54
2.02%
jan 1, 2000
33.643
+6.399
23.49%
jan 1, 2001
45.466
+11.823
35.14%
jan 1, 2002
34.07
-11.395
-25.06%
jan 1, 2003
54.472
+20.401
59.88%
jan 1, 2004
63.403
+8.931
16.4%
jan 1, 2005
64.337
+0.934
1.47%
jan 1, 2006
81.075
+16.737
26.02%
jan 1, 2007
112.616
+31.541
38.9%
jan 1, 2008
100.908
-11.708
-10.4%
jan 1, 2009
104.964
+4.056
4.02%
jan 1, 2010
62.176
-42.788
-40.76%
jan 1, 2011
86.058
+23.882
38.41%
jan 1, 2012
86.058
+0.0
0.0%
jan 1, 2013
86.058
0.0
0.0%
Ranking of countries by current statistics by years