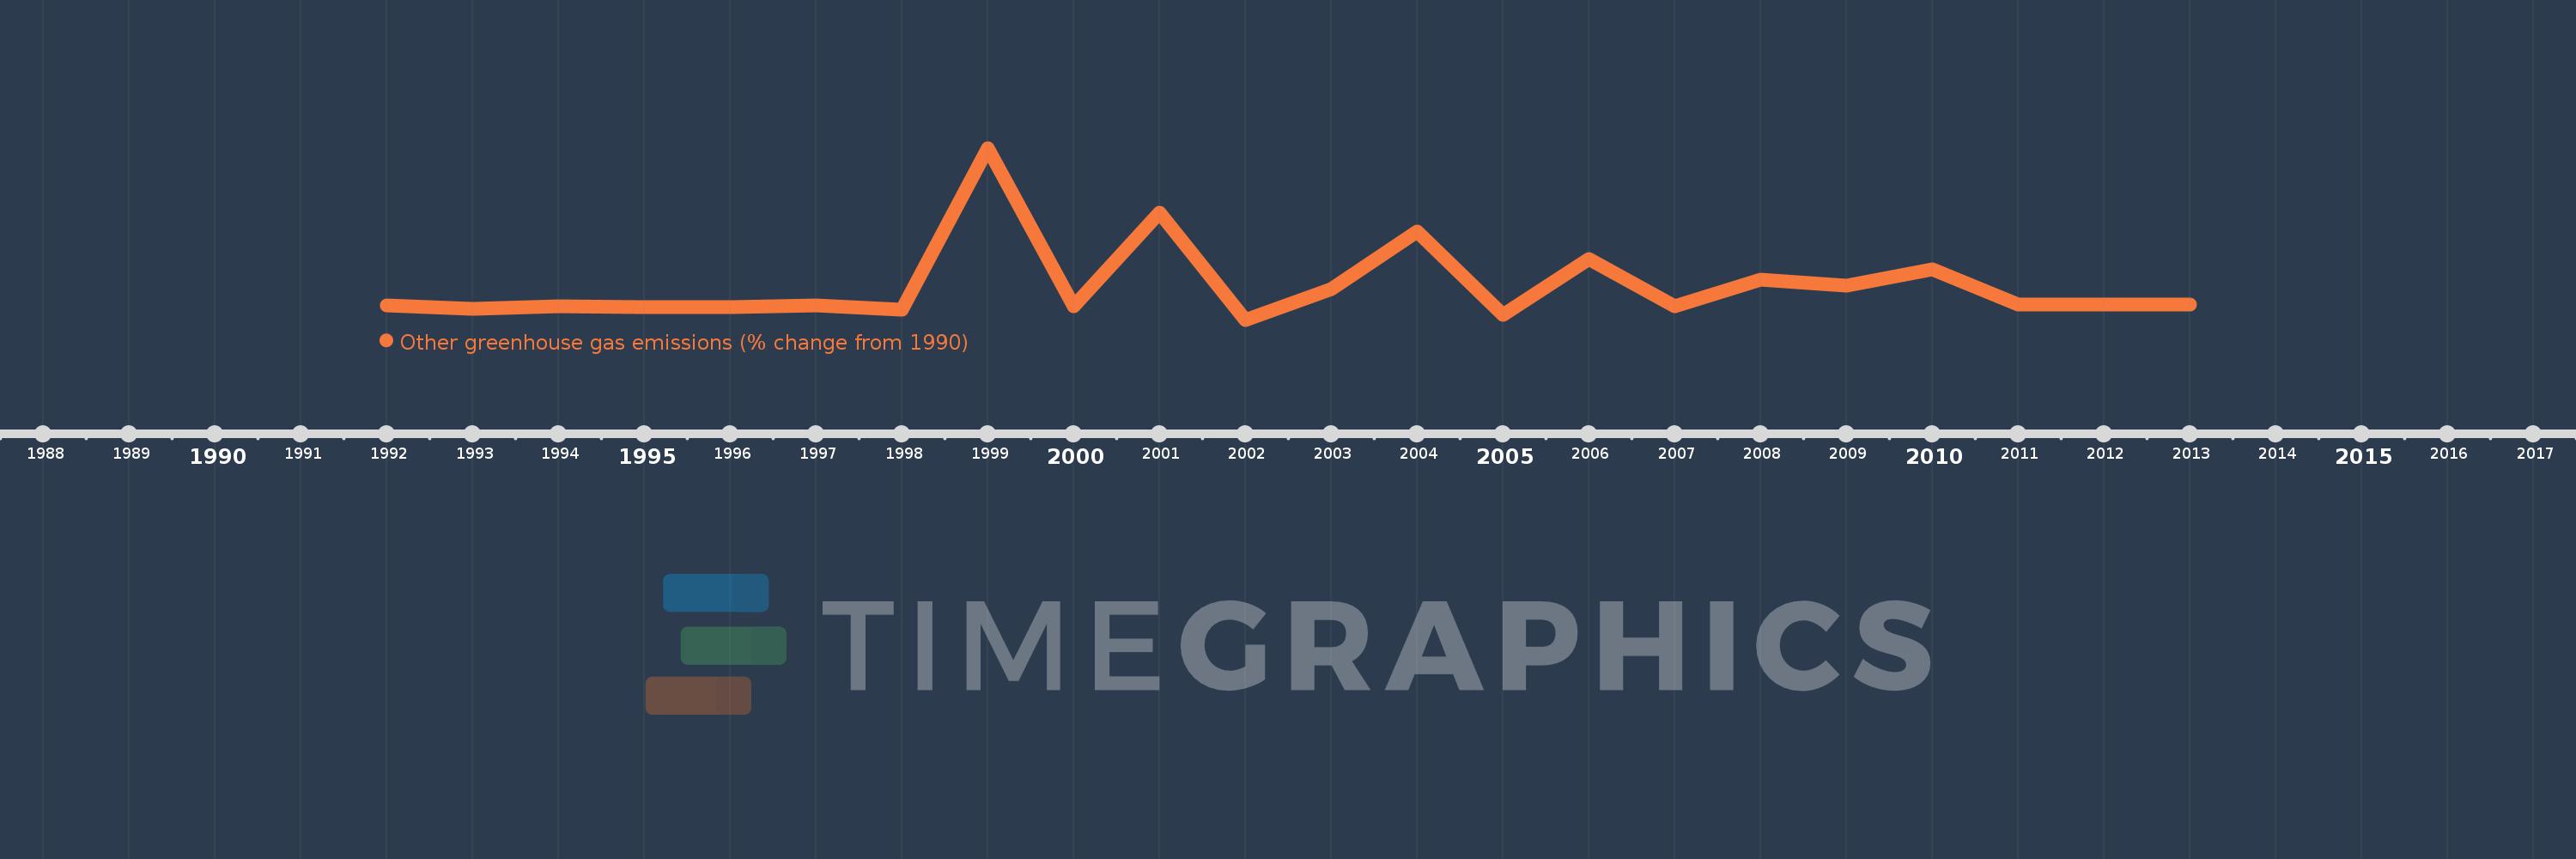
This timeline shows a graph from 1992 to 2013 of Guatemala. No data until 1991. Number of actual observations by date: 22.
Source name:
World Development Indicators
Source organization:
World Bank staff estimates from original source: European Commission, Joint Research Centre (JRC)/Netherlands Environmental Assessment Agency (PBL). Emission Database for Global Atmospheric Research (EDGAR): http://edgar.jrc.ec.europa.eu/.
Categories, topics:
Climate Change, Environment
Last updated:
apr 23, 2017
Indicators value changes by year
Meaning:
152.49
Minimum:
-61.915
jan 1, 2002
Maximum:
1.018K
jan 1, 1999
At the date of observation
Value
Absolute change
Change from the previous value
jan 1, 1992
30.057
+30.057
0.0%
jan 1, 1993
4.02
-26.037
-86.62%
jan 1, 1994
24.31
+20.29
504.69%
jan 1, 1995
16.763
-7.547
-31.04%
jan 1, 1996
16.416
-0.348
-2.07%
jan 1, 1997
27.408
+10.992
66.96%
jan 1, 1998
1.193
-26.214
-95.65%
jan 1, 1999
1.018K
+1.016K
85.17K%
jan 1, 2000
24.343
-993.236
-97.61%
jan 1, 2001
613.663
+589.321
2.42K%
jan 1, 2002
-61.915
-675.578
-110.09%
jan 1, 2003
133.307
+195.222
-315.31%
jan 1, 2004
490.947
+357.64
268.28%
jan 1, 2005
-30.532
-521.479
-106.22%
jan 1, 2006
320.221
+350.753
-1.15K%
jan 1, 2007
24.584
-295.636
-92.32%
jan 1, 2008
188.985
+164.4
668.73%
jan 1, 2009
152.442
-36.542
-19.34%
jan 1, 2010
253.375
+100.933
66.21%
jan 1, 2011
35.868
-217.507
-85.84%
jan 1, 2012
35.868
0.0
0.0%
jan 1, 2013
35.868
0.0
0.0%
Ranking of countries by current statistics by years