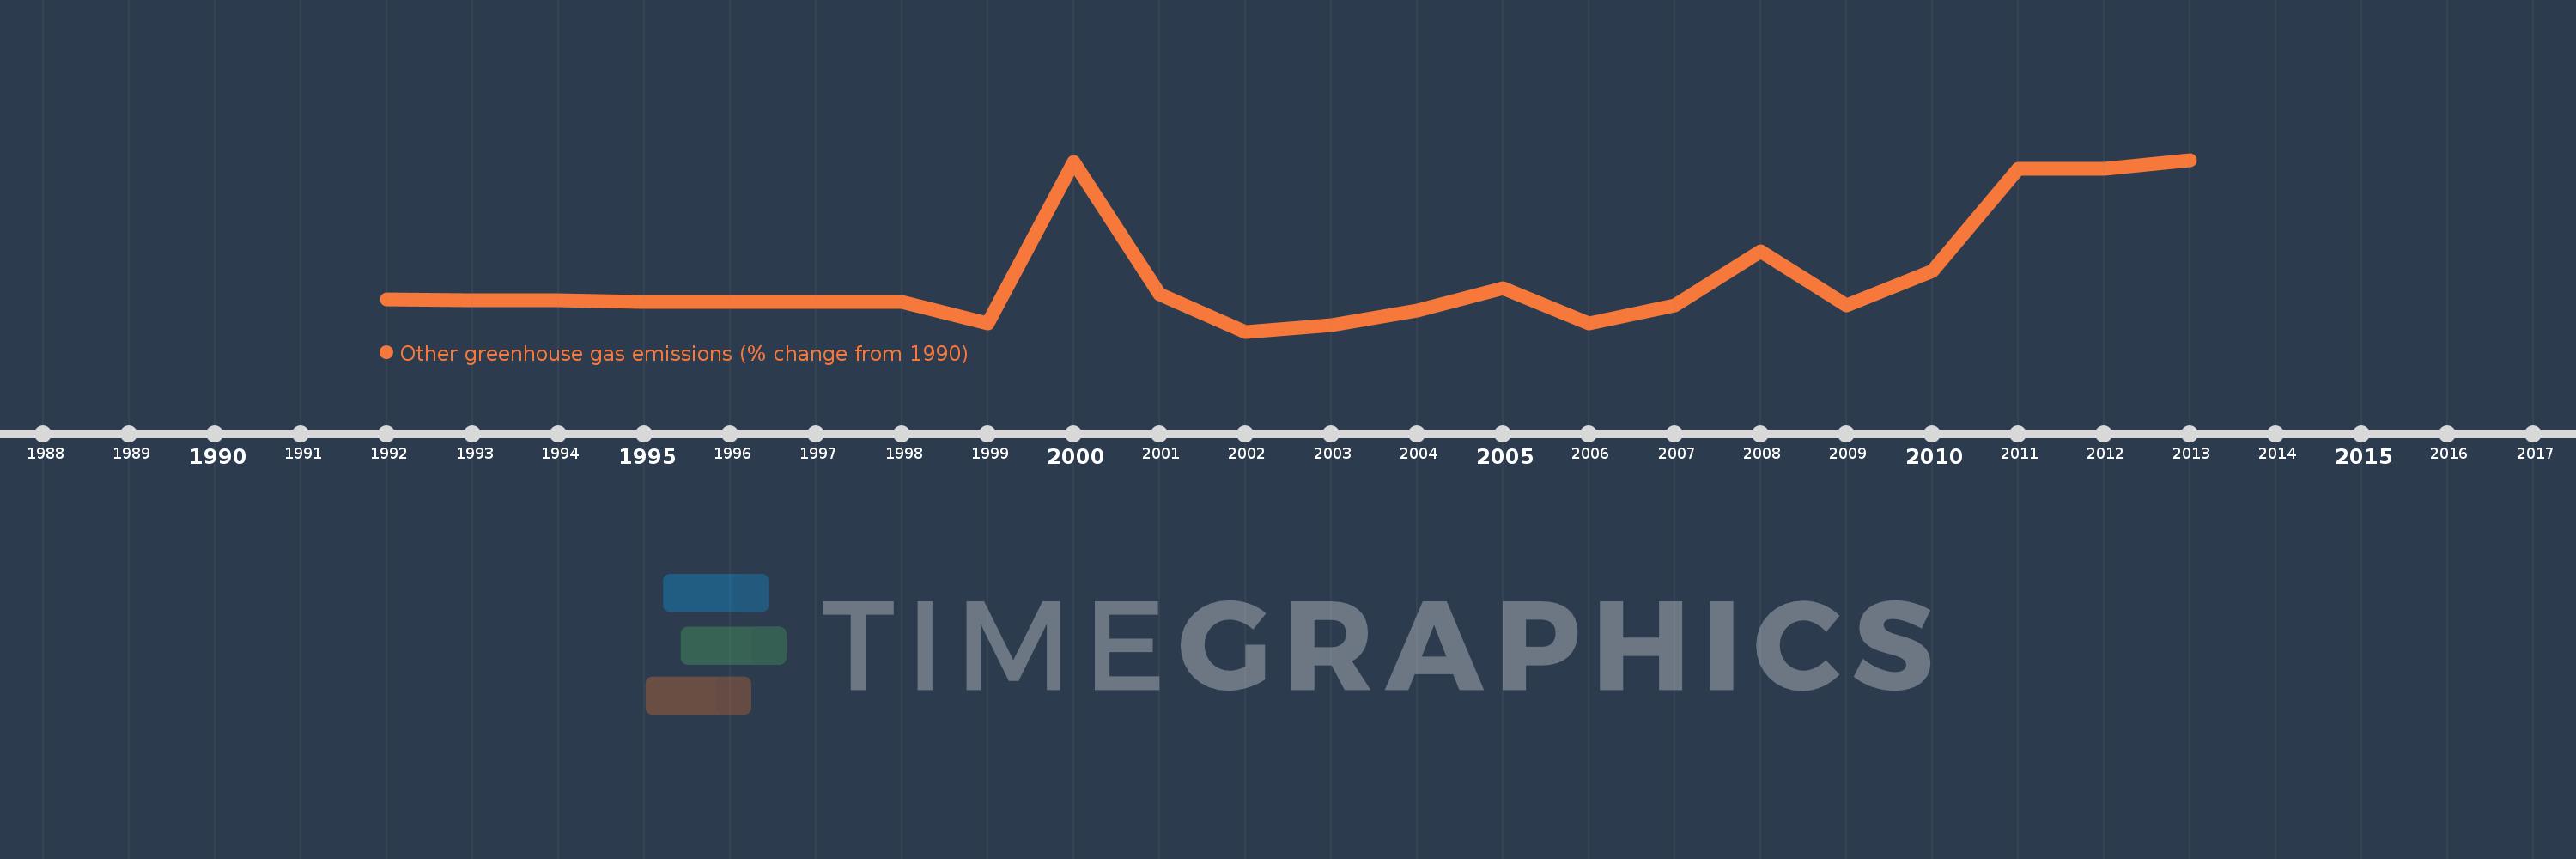
This timeline shows a graph from 1992 to 2013 of South Asia. No data until 1991. Number of actual observations by date: 22.
Source name:
World Development Indicators
Source organization:
World Bank staff estimates from original source: European Commission, Joint Research Centre (JRC)/Netherlands Environmental Assessment Agency (PBL). Emission Database for Global Atmospheric Research (EDGAR): http://edgar.jrc.ec.europa.eu/.
Categories, topics:
Climate Change, Environment
Last updated:
apr 23, 2017
Indicators value changes by year
Meaning:
30.354
Minimum:
-42.978
jan 1, 2002
Maximum:
188.182
jan 1, 2013
At the date of observation
Value
Absolute change
Change from the previous value
jan 1, 1992
0.725
+0.725
0.0%
jan 1, 1993
-0.283
-1.008
-138.97%
jan 1, 1994
-1.16
-0.877
310.29%
jan 1, 1995
-2.582
-1.422
122.59%
jan 1, 1996
-3.202
-0.621
24.04%
jan 1, 1997
-3.655
-0.453
14.15%
jan 1, 1998
-2.858
+0.797
-21.8%
jan 1, 1999
-31.431
-28.572
999.6%
jan 1, 2000
184.86
+216.291
-688.15%
jan 1, 2001
7.758
-177.102
-95.8%
jan 1, 2002
-42.978
-50.737
-653.95%
jan 1, 2003
-34.053
+8.925
-20.77%
jan 1, 2004
-14.586
+19.467
-57.17%
jan 1, 2005
15.564
+30.15
-206.71%
jan 1, 2006
-32.466
-48.03
-308.59%
jan 1, 2007
-7.265
+25.201
-77.62%
jan 1, 2008
65.324
+72.589
-999.13%
jan 1, 2009
-7.354
-72.678
-111.26%
jan 1, 2010
37.998
+45.353
-616.69%
jan 1, 2011
175.62
+137.621
362.18%
jan 1, 2012
175.62
0.0
0.0%
jan 1, 2013
188.182
+12.562
7.15%
Ranking of countries by current statistics by years