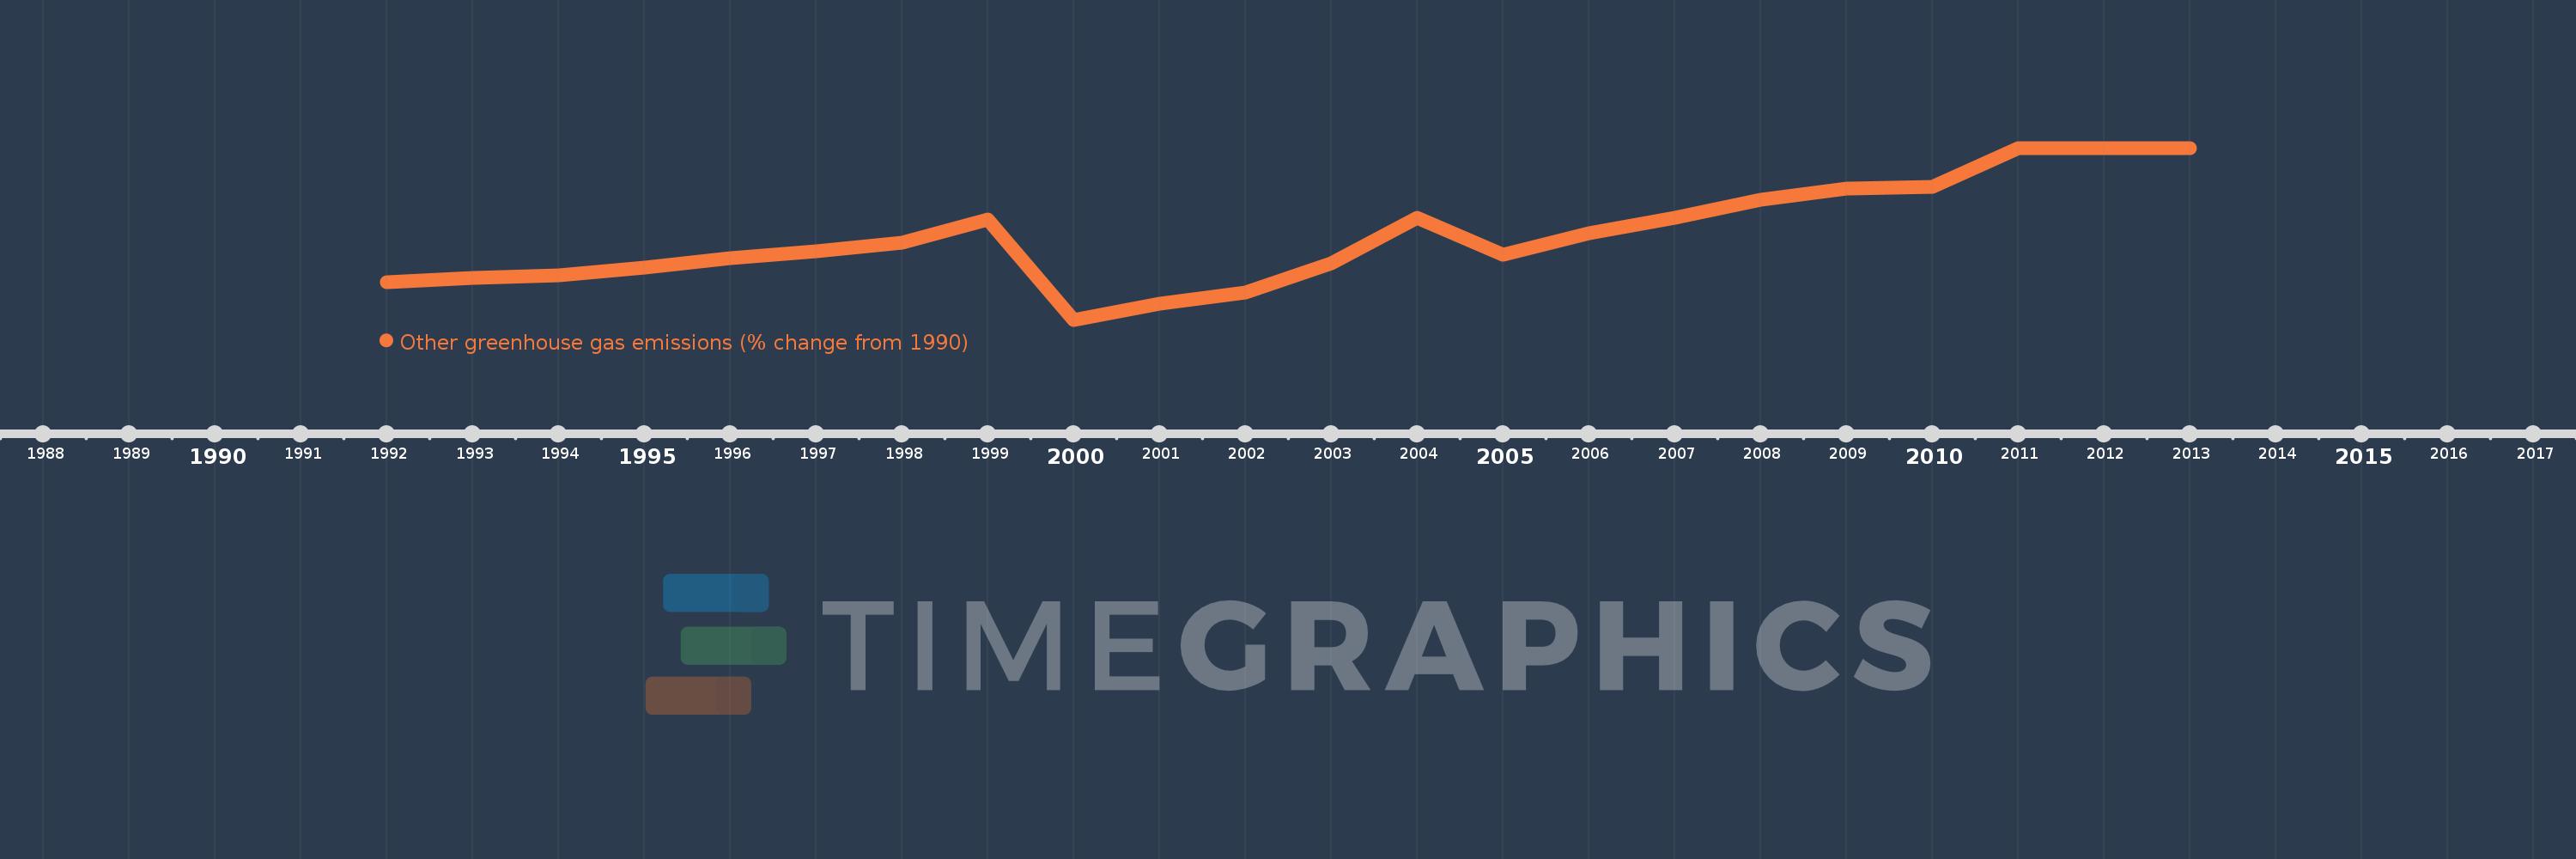
This timeline shows a graph from 1992 to 2013 of Finland. No data until 1991. Number of actual observations by date: 22.
Source name:
World Development Indicators
Source organization:
World Bank staff estimates from original source: European Commission, Joint Research Centre (JRC)/Netherlands Environmental Assessment Agency (PBL). Emission Database for Global Atmospheric Research (EDGAR): http://edgar.jrc.ec.europa.eu/.
Categories, topics:
Climate Change, Environment
Last updated:
apr 23, 2017
Indicators value changes by year
Meaning:
36.022
Minimum:
-28.368
jan 1, 2000
Maximum:
104.08
jan 1, 2013
At the date of observation
Value
Absolute change
Change from the previous value
jan 1, 1992
0.446
+0.446
0.0%
jan 1, 1993
4.17
+3.724
834.71%
jan 1, 1994
5.916
+1.746
41.87%
jan 1, 1995
11.972
+6.056
102.36%
jan 1, 1996
19.284
+7.312
61.07%
jan 1, 1997
24.715
+5.431
28.16%
jan 1, 1998
30.966
+6.251
25.29%
jan 1, 1999
48.877
+17.911
57.84%
jan 1, 2000
-28.368
-77.245
-158.04%
jan 1, 2001
-15.672
+12.696
-44.75%
jan 1, 2002
-7.668
+8.004
-51.07%
jan 1, 2003
15.022
+22.691
-295.9%
jan 1, 2004
49.977
+34.955
232.69%
jan 1, 2005
21.446
-28.531
-57.09%
jan 1, 2006
38.33
+16.884
78.73%
jan 1, 2007
49.973
+11.643
30.37%
jan 1, 2008
64.146
+14.173
28.36%
jan 1, 2009
72.804
+8.658
13.5%
jan 1, 2010
73.896
+1.092
1.5%
jan 1, 2011
104.08
+30.184
40.85%
jan 1, 2012
104.08
0.0
0.0%
jan 1, 2013
104.08
+0.0
0.0%
Ranking of countries by current statistics by years