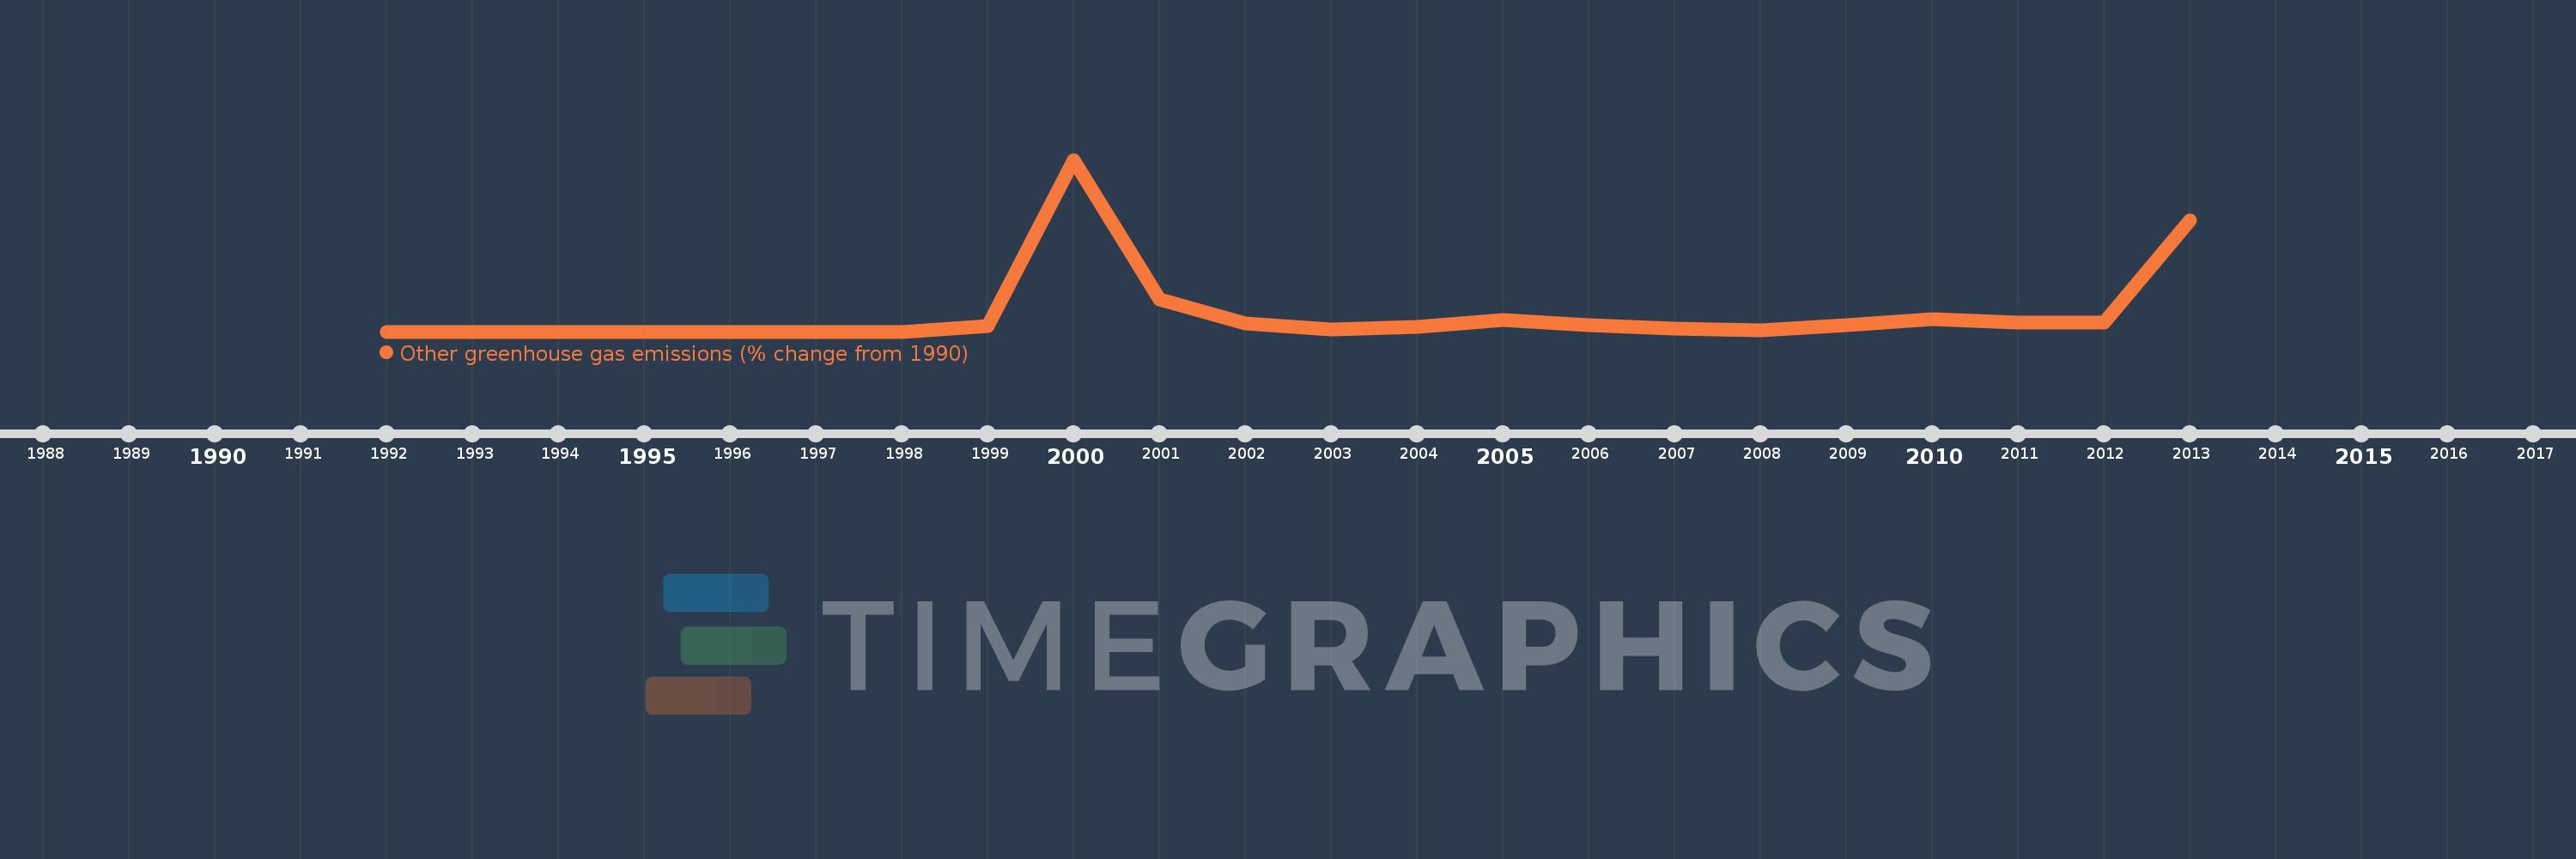
This timeline shows a graph from 1992 to 2013 of Nepal. No data until 1991. Number of actual observations by date: 22.
Source name:
World Development Indicators
Source organization:
World Bank staff estimates from original source: European Commission, Joint Research Centre (JRC)/Netherlands Environmental Assessment Agency (PBL). Emission Database for Global Atmospheric Research (EDGAR): http://edgar.jrc.ec.europa.eu/.
Categories, topics:
Climate Change, Environment
Last updated:
apr 23, 2017
Indicators value changes by year
Meaning:
700.036
Minimum:
0.0
jan 1, 1997
Maximum:
6.718K
jan 1, 2000
At the date of observation
Value
Absolute change
Change from the previous value
jan 1, 1992
0.0
+0.0
0.0%
jan 1, 1993
0.0
0.0
0.0%
jan 1, 1994
0.0
0.0
-48.0%
jan 1, 1995
0.0
0.0
-290.38%
jan 1, 1996
0.0
+0.0
-201.01%
jan 1, 1997
0.0
0.0
-249.0%
jan 1, 1998
0.0
+0.0
-167.11%
jan 1, 1999
211.787
+211.787
19076.05 trl%
jan 1, 2000
6.718K
+6.507K
3.07K%
jan 1, 2001
1.255K
-5.463K
-81.32%
jan 1, 2002
309.988
-944.889
-75.3%
jan 1, 2003
76.183
-233.805
-75.42%
jan 1, 2004
192.659
+116.476
152.89%
jan 1, 2005
460.405
+267.746
138.97%
jan 1, 2006
253.042
-207.363
-45.04%
jan 1, 2007
102.382
-150.659
-59.54%
jan 1, 2008
65.527
-36.856
-36.0%
jan 1, 2009
247.854
+182.328
278.25%
jan 1, 2010
487.34
+239.486
96.62%
jan 1, 2011
343.365
-143.975
-29.54%
jan 1, 2012
343.365
0.0
0.0%
jan 1, 2013
4.334K
+3.99K
1.16K%
Ranking of countries by current statistics by years