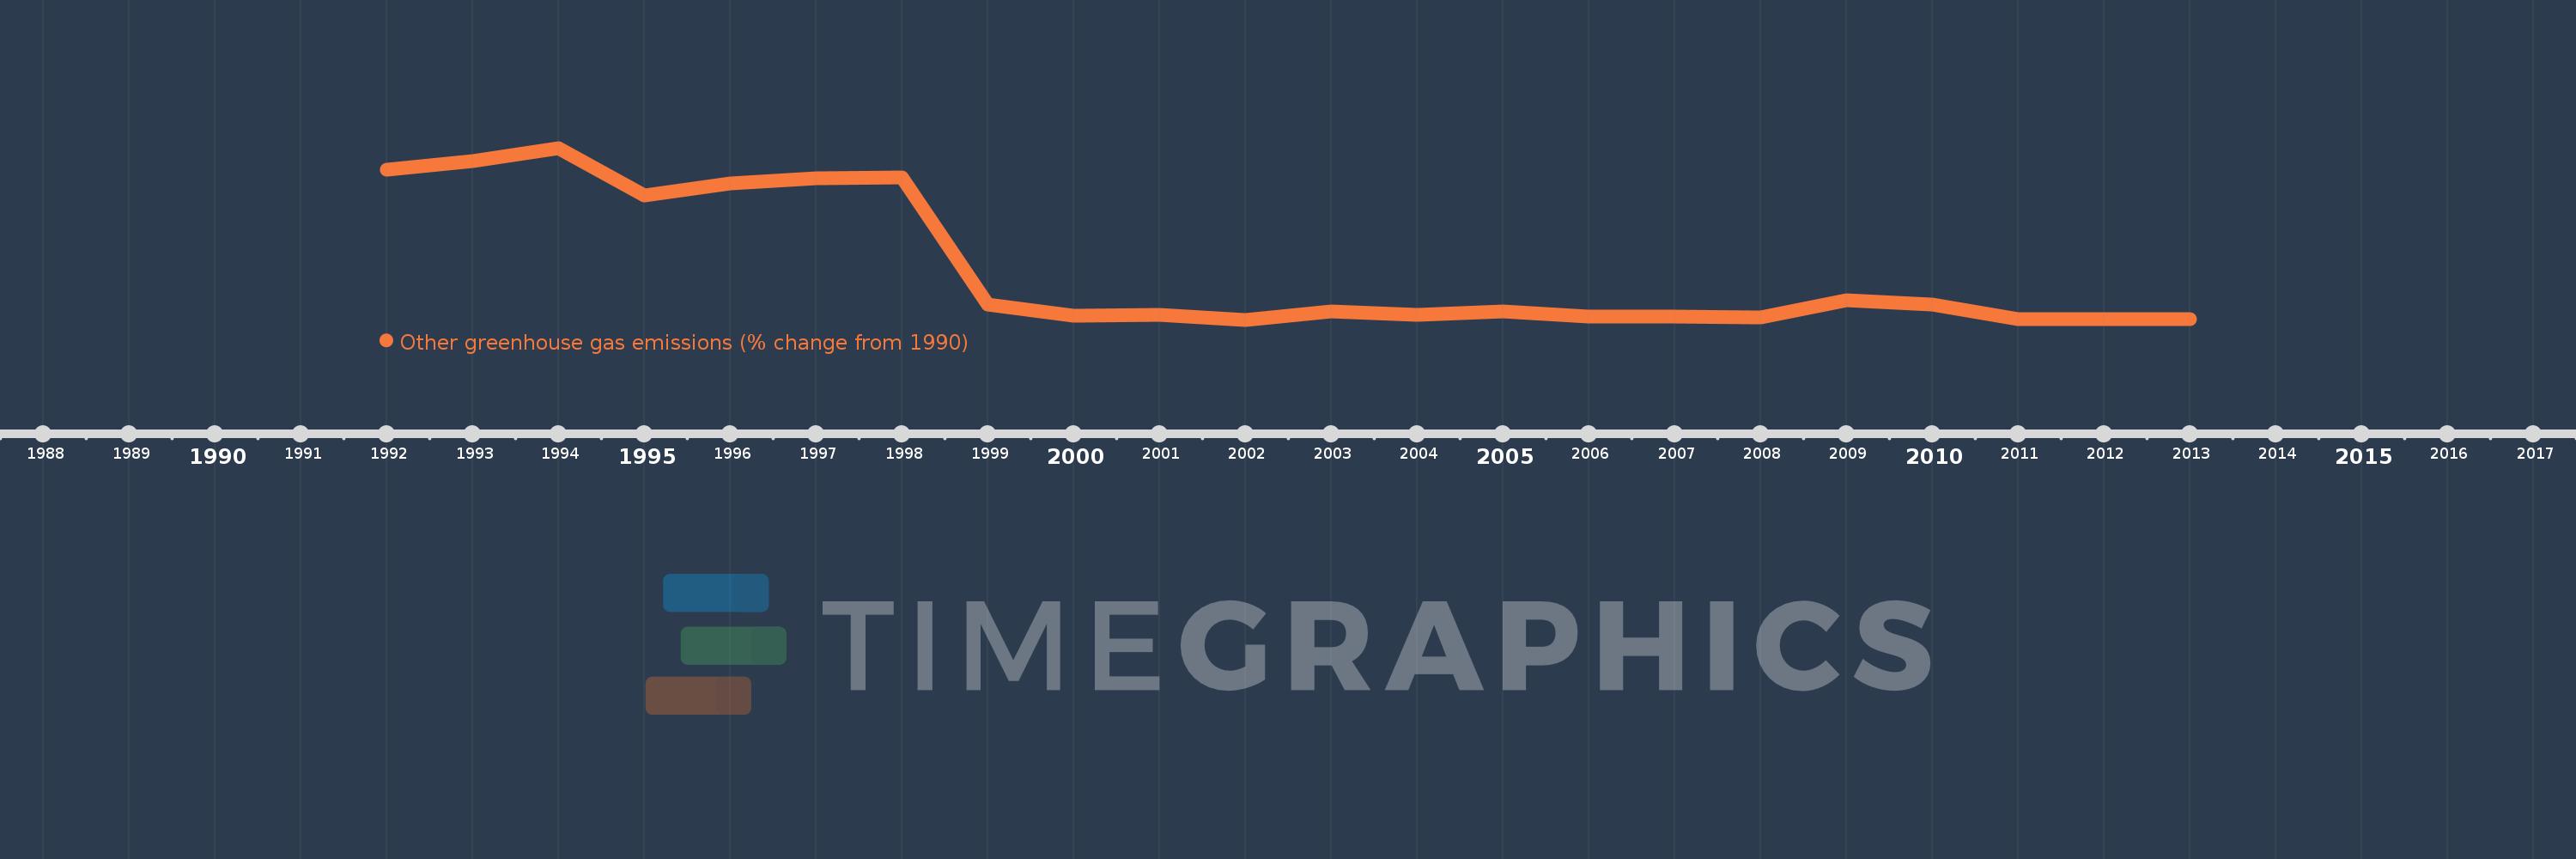
This timeline shows a graph from 1992 to 2013 of Suriname. No data until 1991. Number of actual observations by date: 22.
Source name:
World Development Indicators
Source organization:
World Bank staff estimates from original source: European Commission, Joint Research Centre (JRC)/Netherlands Environmental Assessment Agency (PBL). Emission Database for Global Atmospheric Research (EDGAR): http://edgar.jrc.ec.europa.eu/.
Categories, topics:
Climate Change, Environment
Last updated:
apr 23, 2017
Indicators value changes by year
Meaning:
-67.875
Minimum:
-100.0
jan 1, 2002
Maximum:
8.827
jan 1, 1994
At the date of observation
Value
Absolute change
Change from the previous value
jan 1, 1992
-5.109
-5.109
0.0%
jan 1, 1993
0.271
+5.38
-105.3%
jan 1, 1994
8.827
+8.556
3.16K%
jan 1, 1995
-20.996
-29.822
-337.87%
jan 1, 1996
-13.723
+7.273
-34.64%
jan 1, 1997
-10.494
+3.229
-23.53%
jan 1, 1998
-9.73
+0.764
-7.28%
jan 1, 1999
-90.584
-80.854
830.96%
jan 1, 2000
-97.286
-6.701
7.4%
jan 1, 2001
-97.077
+0.209
-0.21%
jan 1, 2002
-100.0
-2.923
3.01%
jan 1, 2003
-94.45
+5.55
-5.55%
jan 1, 2004
-96.727
-2.276
2.41%
jan 1, 2005
-94.599
+2.128
-2.2%
jan 1, 2006
-97.979
-3.381
3.57%
jan 1, 2007
-97.831
+0.148
-0.15%
jan 1, 2008
-98.586
-0.754
0.77%
jan 1, 2009
-87.473
+11.113
-11.27%
jan 1, 2010
-90.302
-2.829
3.23%
jan 1, 2011
-99.798
-9.496
10.52%
jan 1, 2012
-99.798
0.0
0.0%
jan 1, 2013
-99.798
0.0
0.0%
Ranking of countries by current statistics by years