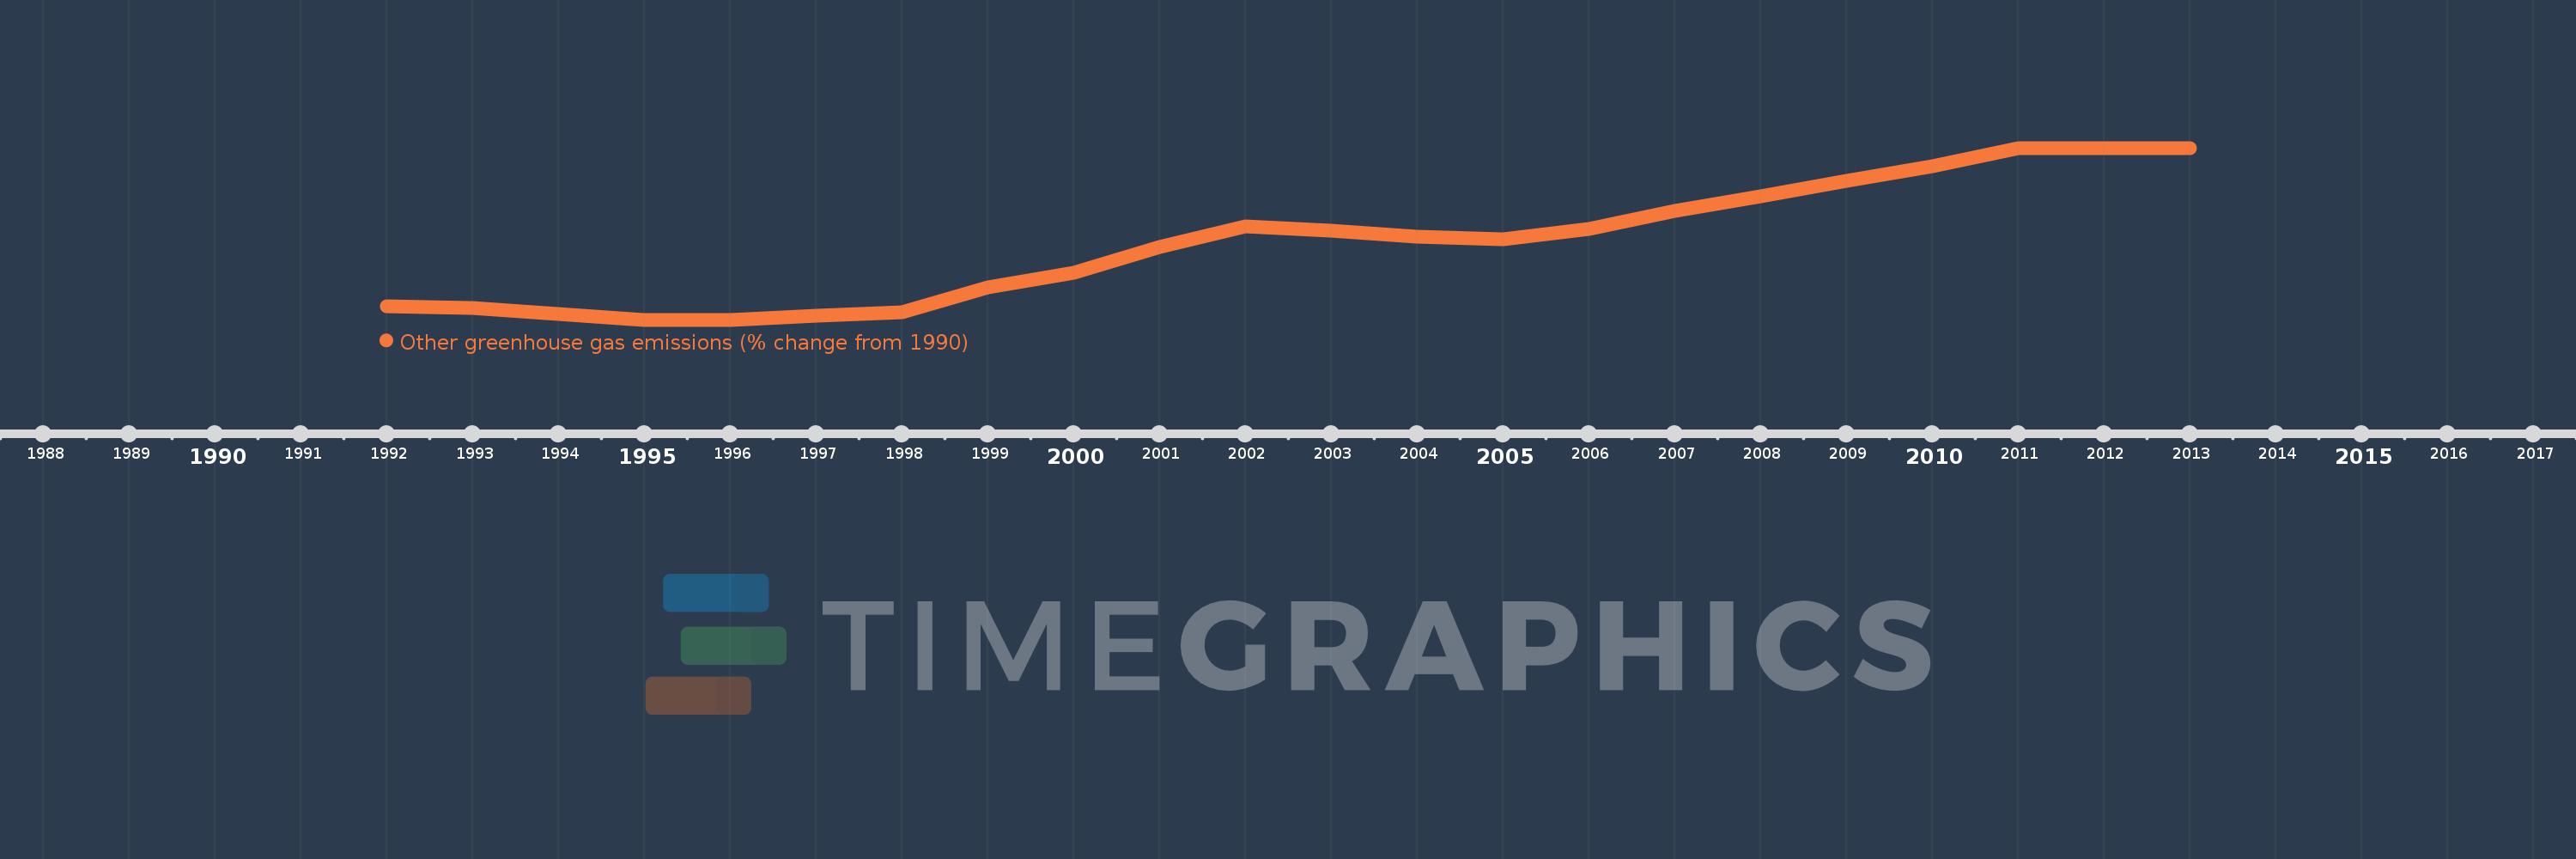
This timeline shows a graph from 1992 to 2013 of Israel. No data until 1991. Number of actual observations by date: 22.
Source name:
World Development Indicators
Source organization:
World Bank staff estimates from original source: European Commission, Joint Research Centre (JRC)/Netherlands Environmental Assessment Agency (PBL). Emission Database for Global Atmospheric Research (EDGAR): http://edgar.jrc.ec.europa.eu/.
Categories, topics:
Climate Change, Environment
Last updated:
apr 23, 2017
Indicators value changes by year
Meaning:
52.303
Minimum:
-13.384
jan 1, 1996
Maximum:
135.133
jan 1, 2011
At the date of observation
Value
Absolute change
Change from the previous value
jan 1, 1992
-1.689
-1.689
0.0%
jan 1, 1993
-3.336
-1.648
97.57%
jan 1, 1994
-8.533
-5.197
155.76%
jan 1, 1995
-13.287
-4.754
55.71%
jan 1, 1996
-13.384
-0.097
0.73%
jan 1, 1997
-9.894
+3.491
-26.08%
jan 1, 1998
-6.761
+3.132
-31.66%
jan 1, 1999
14.74
+21.502
-318.0%
jan 1, 2000
27.591
+12.851
87.18%
jan 1, 2001
49.587
+21.996
79.72%
jan 1, 2002
67.567
+17.98
36.26%
jan 1, 2003
63.307
-4.261
-6.31%
jan 1, 2004
58.386
-4.921
-7.77%
jan 1, 2005
56.421
-1.964
-3.36%
jan 1, 2006
64.897
+8.475
15.02%
jan 1, 2007
80.82
+15.923
24.54%
jan 1, 2008
93.1
+12.28
15.19%
jan 1, 2009
106.589
+13.489
14.49%
jan 1, 2010
119.141
+12.552
11.78%
jan 1, 2011
135.133
+15.992
13.42%
jan 1, 2012
135.133
0.0
0.0%
jan 1, 2013
135.133
0.0
0.0%
Ranking of countries by current statistics by years