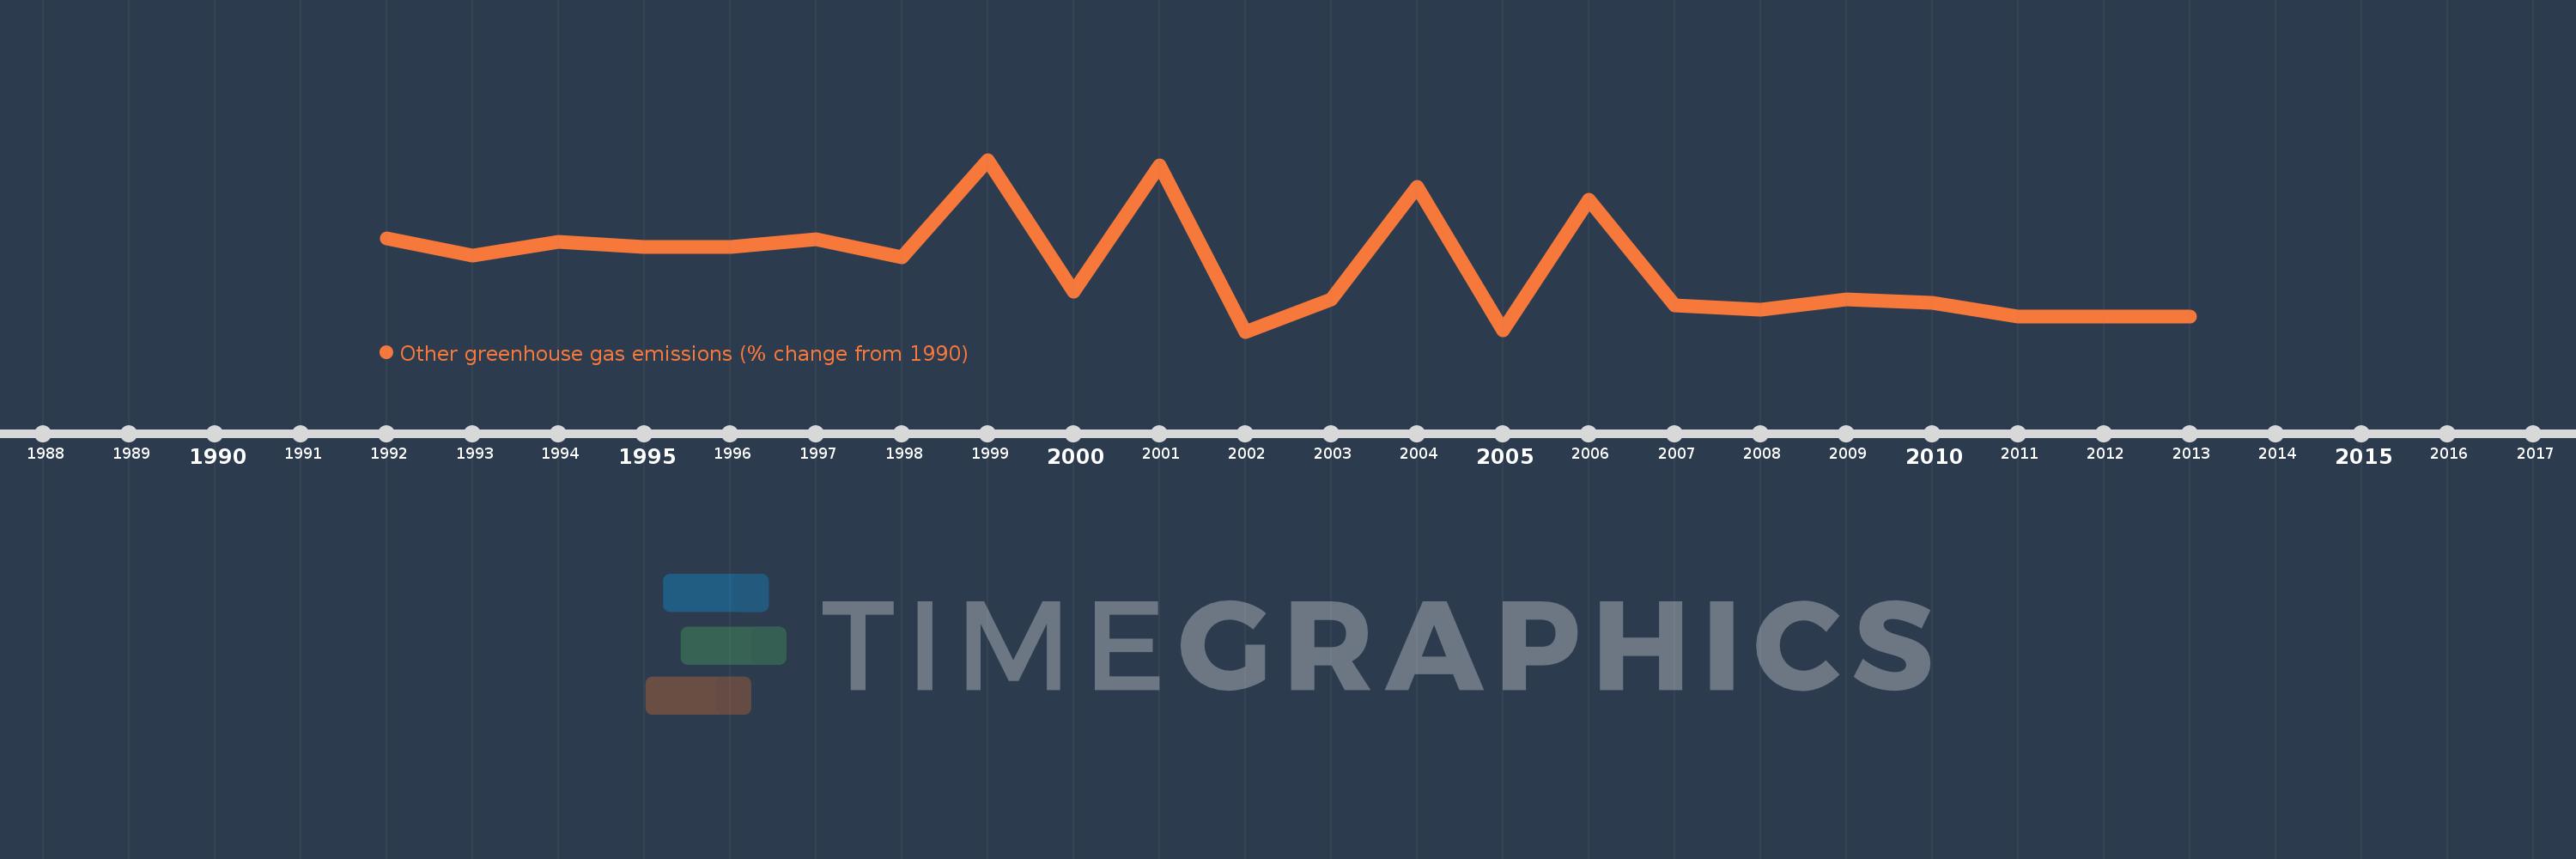
This timeline shows a graph from 1992 to 2013 of Honduras. No data until 1991. Number of actual observations by date: 22.
Source name:
World Development Indicators
Source organization:
World Bank staff estimates from original source: European Commission, Joint Research Centre (JRC)/Netherlands Environmental Assessment Agency (PBL). Emission Database for Global Atmospheric Research (EDGAR): http://edgar.jrc.ec.europa.eu/.
Categories, topics:
Climate Change, Environment
Last updated:
apr 23, 2017
Indicators value changes by year
Meaning:
-8.868
Minimum:
-84.743
jan 1, 2002
Maximum:
114.777
jan 1, 1999
At the date of observation
Value
Absolute change
Change from the previous value
jan 1, 1992
23.364
+23.364
0.0%
jan 1, 1993
3.7
-19.664
-84.16%
jan 1, 1994
19.497
+15.797
426.97%
jan 1, 1995
13.885
-5.612
-28.78%
jan 1, 1996
13.68
-0.205
-1.48%
jan 1, 1997
22.049
+8.369
61.18%
jan 1, 1998
1.847
-20.202
-91.62%
jan 1, 1999
114.777
+112.93
6.11K%
jan 1, 2000
-38.853
-153.63
-133.85%
jan 1, 2001
108.781
+147.634
-379.98%
jan 1, 2002
-84.743
-193.524
-177.9%
jan 1, 2003
-47.306
+37.437
-44.18%
jan 1, 2004
83.75
+131.056
-277.04%
jan 1, 2005
-83.551
-167.301
-199.76%
jan 1, 2006
68.388
+151.938
-181.85%
jan 1, 2007
-54.538
-122.925
-179.75%
jan 1, 2008
-59.49
-4.953
9.08%
jan 1, 2009
-47.671
+11.819
-19.87%
jan 1, 2010
-51.306
-3.635
7.62%
jan 1, 2011
-67.118
-15.812
30.82%
jan 1, 2012
-67.118
0.0
0.0%
jan 1, 2013
-67.118
+0.0
0.0%
Ranking of countries by current statistics by years