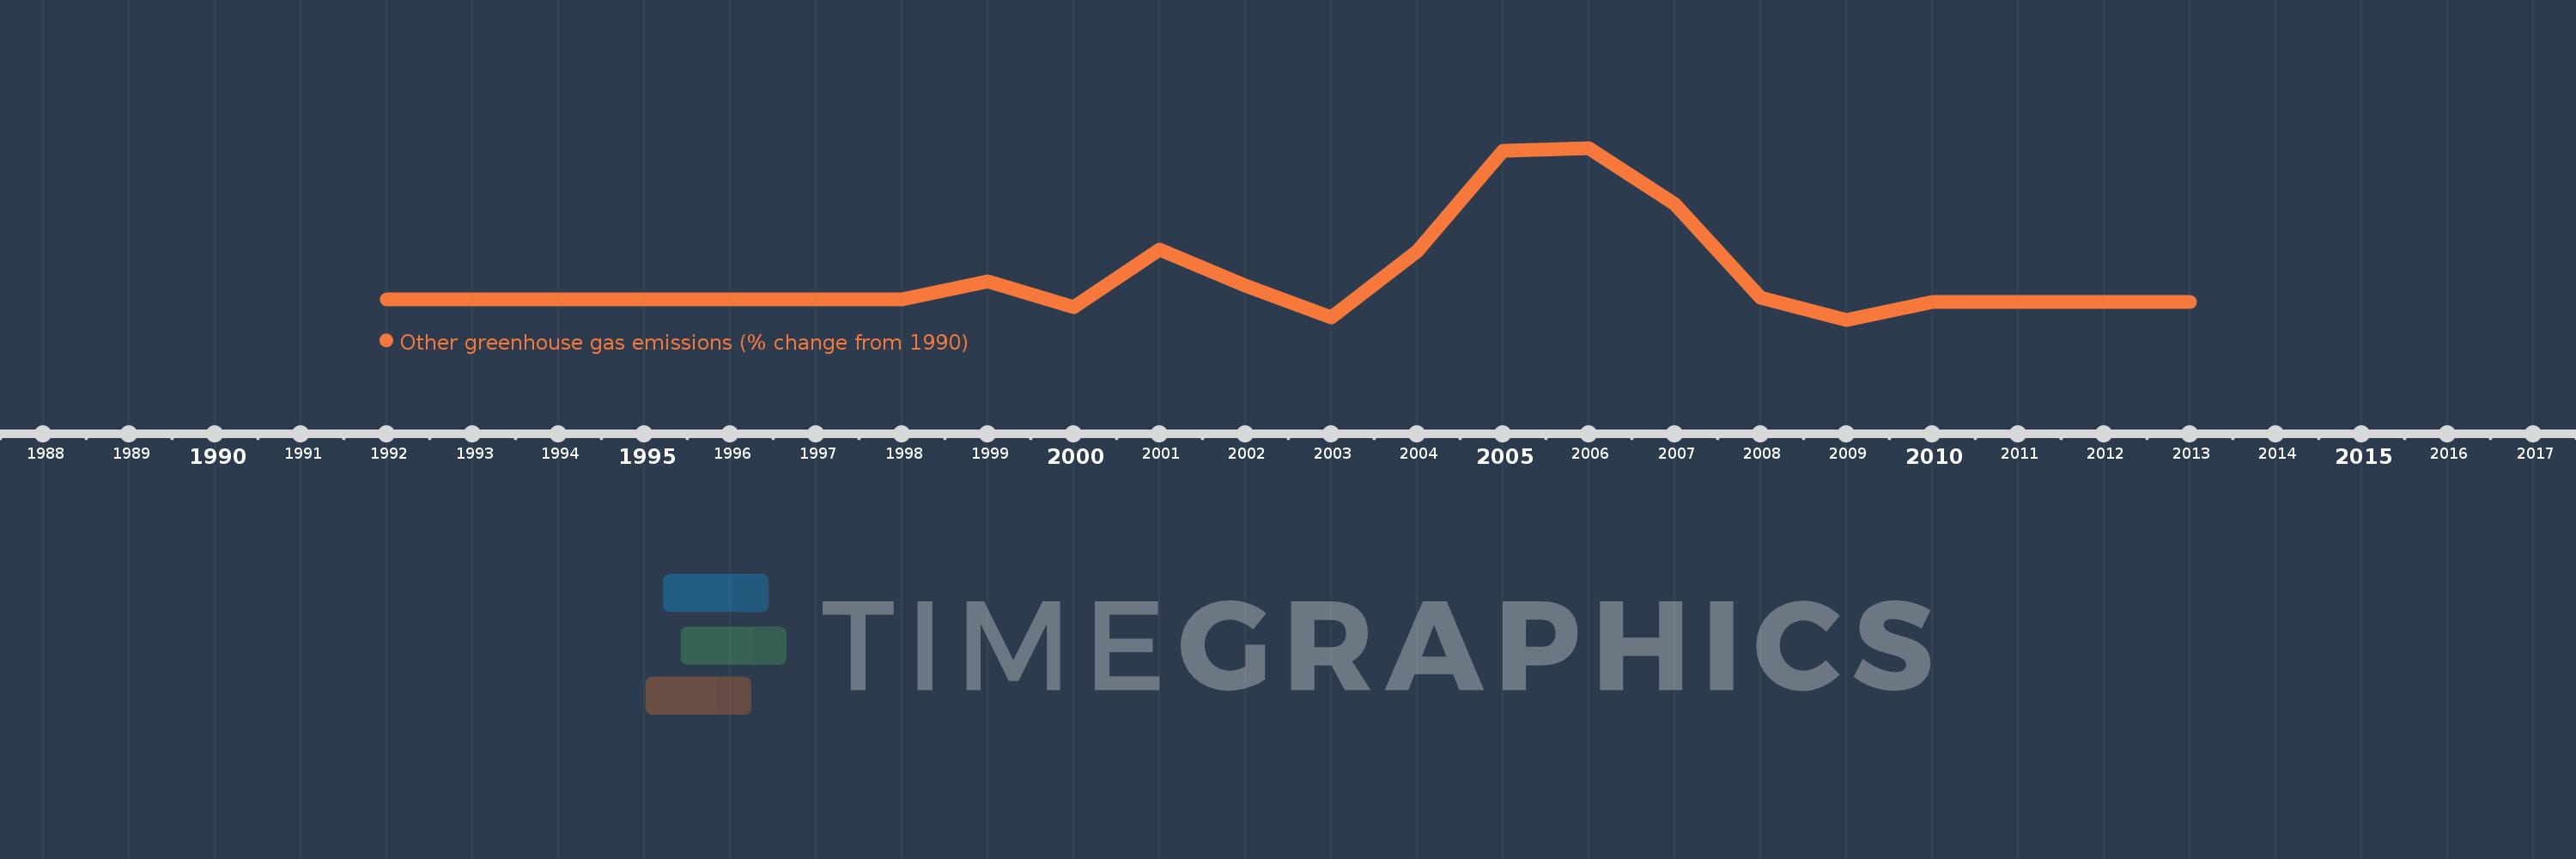
This timeline shows a graph from 1992 to 2013 of Morocco. No data until 1991. Number of actual observations by date: 22.
Source name:
World Development Indicators
Source organization:
World Bank staff estimates from original source: European Commission, Joint Research Centre (JRC)/Netherlands Environmental Assessment Agency (PBL). Emission Database for Global Atmospheric Research (EDGAR): http://edgar.jrc.ec.europa.eu/.
Categories, topics:
Climate Change, Environment
Last updated:
apr 23, 2017
Indicators value changes by year
Meaning:
104.766
Minimum:
-100.0
jan 1, 2009
Maximum:
741.303
jan 1, 2006
At the date of observation
Value
Absolute change
Change from the previous value
jan 1, 1992
0.0
0.0
0.0%
jan 1, 1993
0.0
+0.0
-100.0%
jan 1, 1994
0.0
0.0
%
jan 1, 1995
0.0
0.0
0.0%
jan 1, 1996
0.0
0.0
0.0%
jan 1, 1997
0.0
0.0
500.22%
jan 1, 1998
0.0
+0.0
-100.0%
jan 1, 1999
88.571
+88.571
%
jan 1, 2000
-38.704
-127.275
-143.7%
jan 1, 2001
242.857
+281.561
-727.47%
jan 1, 2002
68.039
-174.818
-71.98%
jan 1, 2003
-87.845
-155.884
-229.11%
jan 1, 2004
235.645
+323.49
-368.25%
jan 1, 2005
727.103
+491.458
208.56%
jan 1, 2006
741.303
+14.2
1.95%
jan 1, 2007
465.141
-276.162
-37.25%
jan 1, 2008
9.034
-456.106
-98.06%
jan 1, 2009
-100.0
-109.034
-1.21K%
jan 1, 2010
-13.823
+86.177
-86.18%
jan 1, 2011
-10.826
+2.997
-21.68%
jan 1, 2012
-10.826
0.0
0.0%
jan 1, 2013
-10.826
+0.0
0.0%
Ranking of countries by current statistics by years