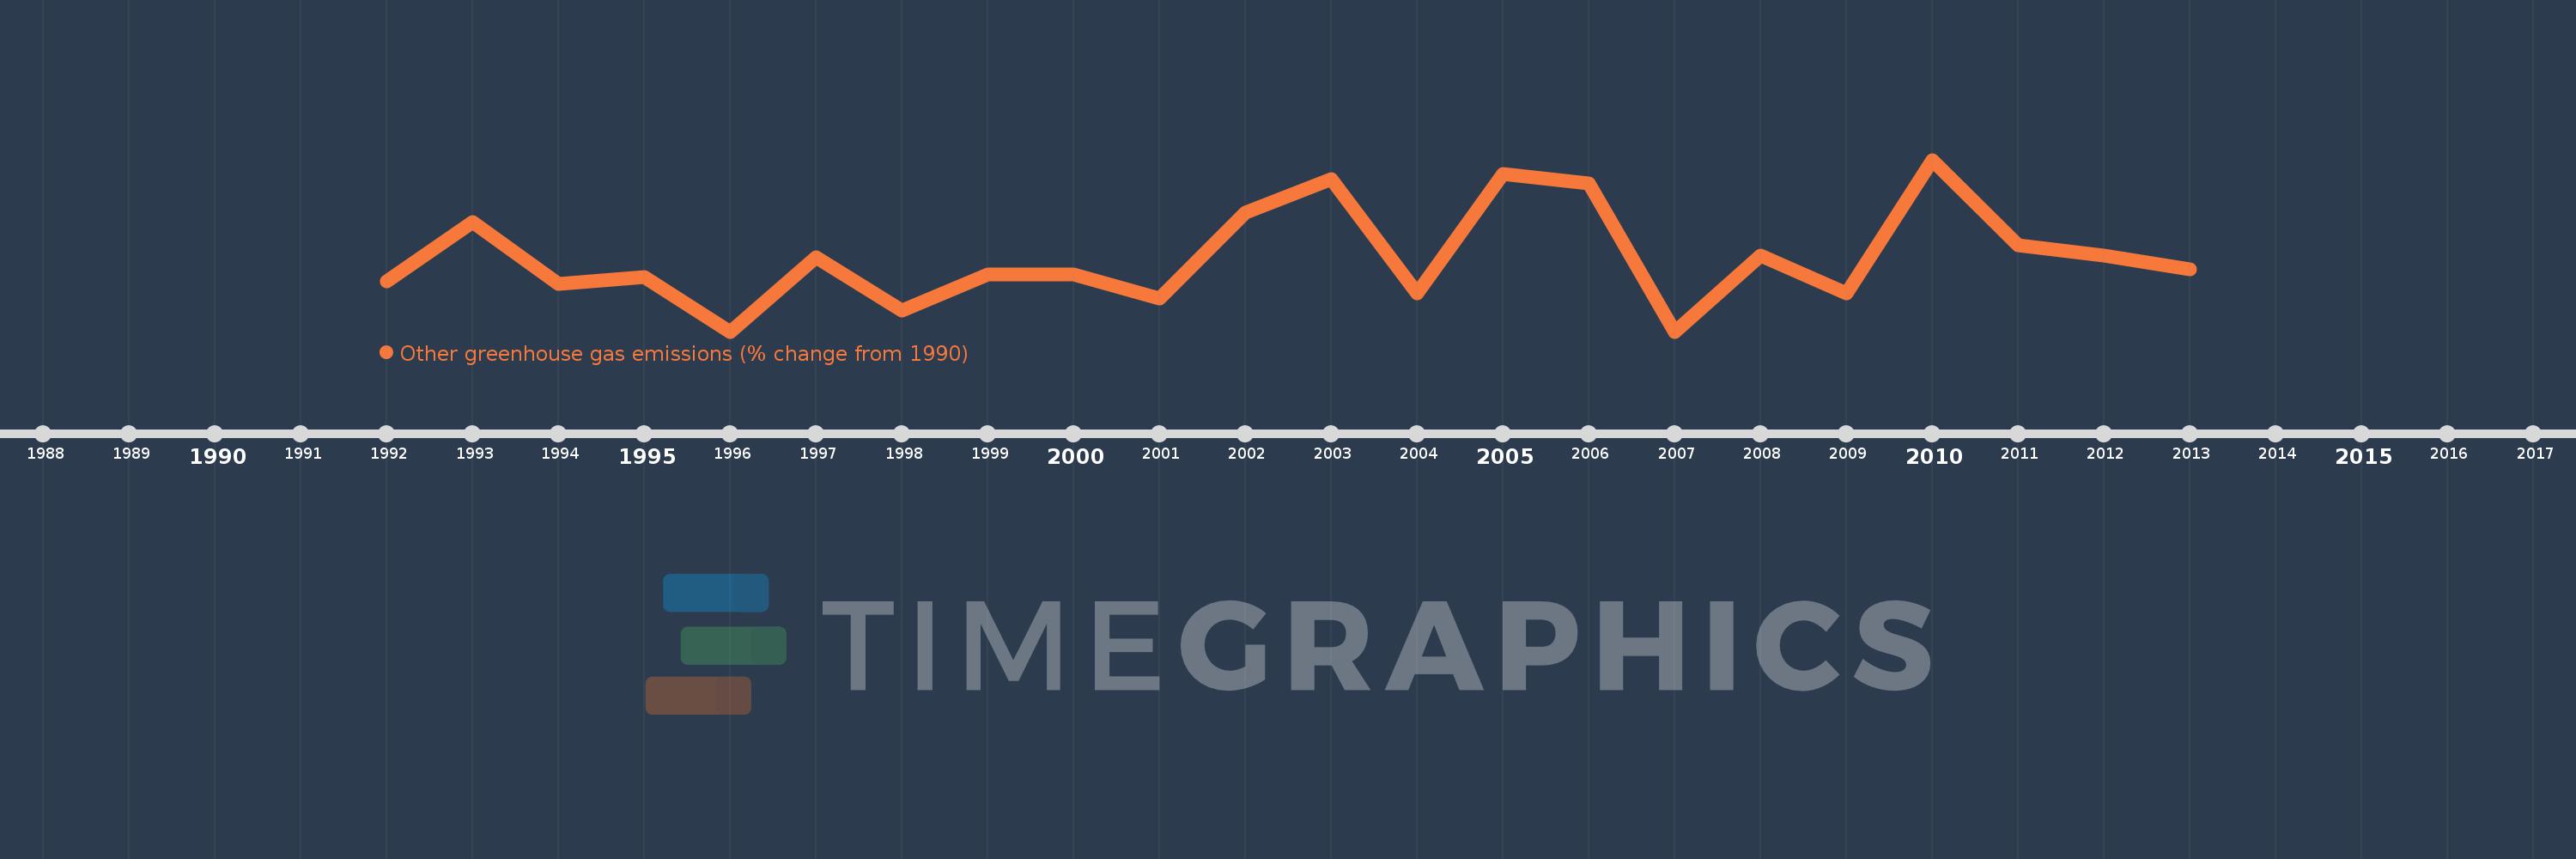
This timeline shows a graph from 1992 to 2013 of Gibraltar. No data until 1991. Number of actual observations by date: 22.
Source name:
World Development Indicators
Source organization:
World Bank staff estimates from original source: European Commission, Joint Research Centre (JRC)/Netherlands Environmental Assessment Agency (PBL). Emission Database for Global Atmospheric Research (EDGAR): http://edgar.jrc.ec.europa.eu/.
Categories, topics:
Climate Change, Environment
Last updated:
apr 23, 2017
Indicators value changes by year
Meaning:
-76.86
Minimum:
-218.182
jan 1, 1996
Maximum:
109.091
jan 1, 2010
At the date of observation
Value
Absolute change
Change from the previous value
jan 1, 1992
-122.727
-122.727
0.0%
jan 1, 1993
-9.091
+113.636
-92.59%
jan 1, 1994
-127.273
-118.182
1.3K%
jan 1, 1995
-113.636
+13.636
-10.71%
jan 1, 1996
-218.182
-104.545
92.0%
jan 1, 1997
-77.273
+140.909
-64.58%
jan 1, 1998
-177.273
-100.0
129.41%
jan 1, 1999
-109.091
+68.182
-38.46%
jan 1, 2000
-109.091
0.0
0.0%
jan 1, 2001
-154.545
-45.455
41.67%
jan 1, 2002
9.091
+163.636
-105.88%
jan 1, 2003
72.727
+63.636
700.0%
jan 1, 2004
-145.455
-218.182
-300.0%
jan 1, 2005
81.818
+227.273
-156.25%
jan 1, 2006
63.636
-18.182
-22.22%
jan 1, 2007
-218.182
-281.818
-442.86%
jan 1, 2008
-72.727
+145.455
-66.67%
jan 1, 2009
-145.455
-72.727
100.0%
jan 1, 2010
109.091
+254.545
-175.0%
jan 1, 2011
-54.545
-163.636
-150.0%
jan 1, 2012
-72.727
-18.182
33.33%
jan 1, 2013
-100.0
-27.273
37.5%
Ranking of countries by current statistics by years