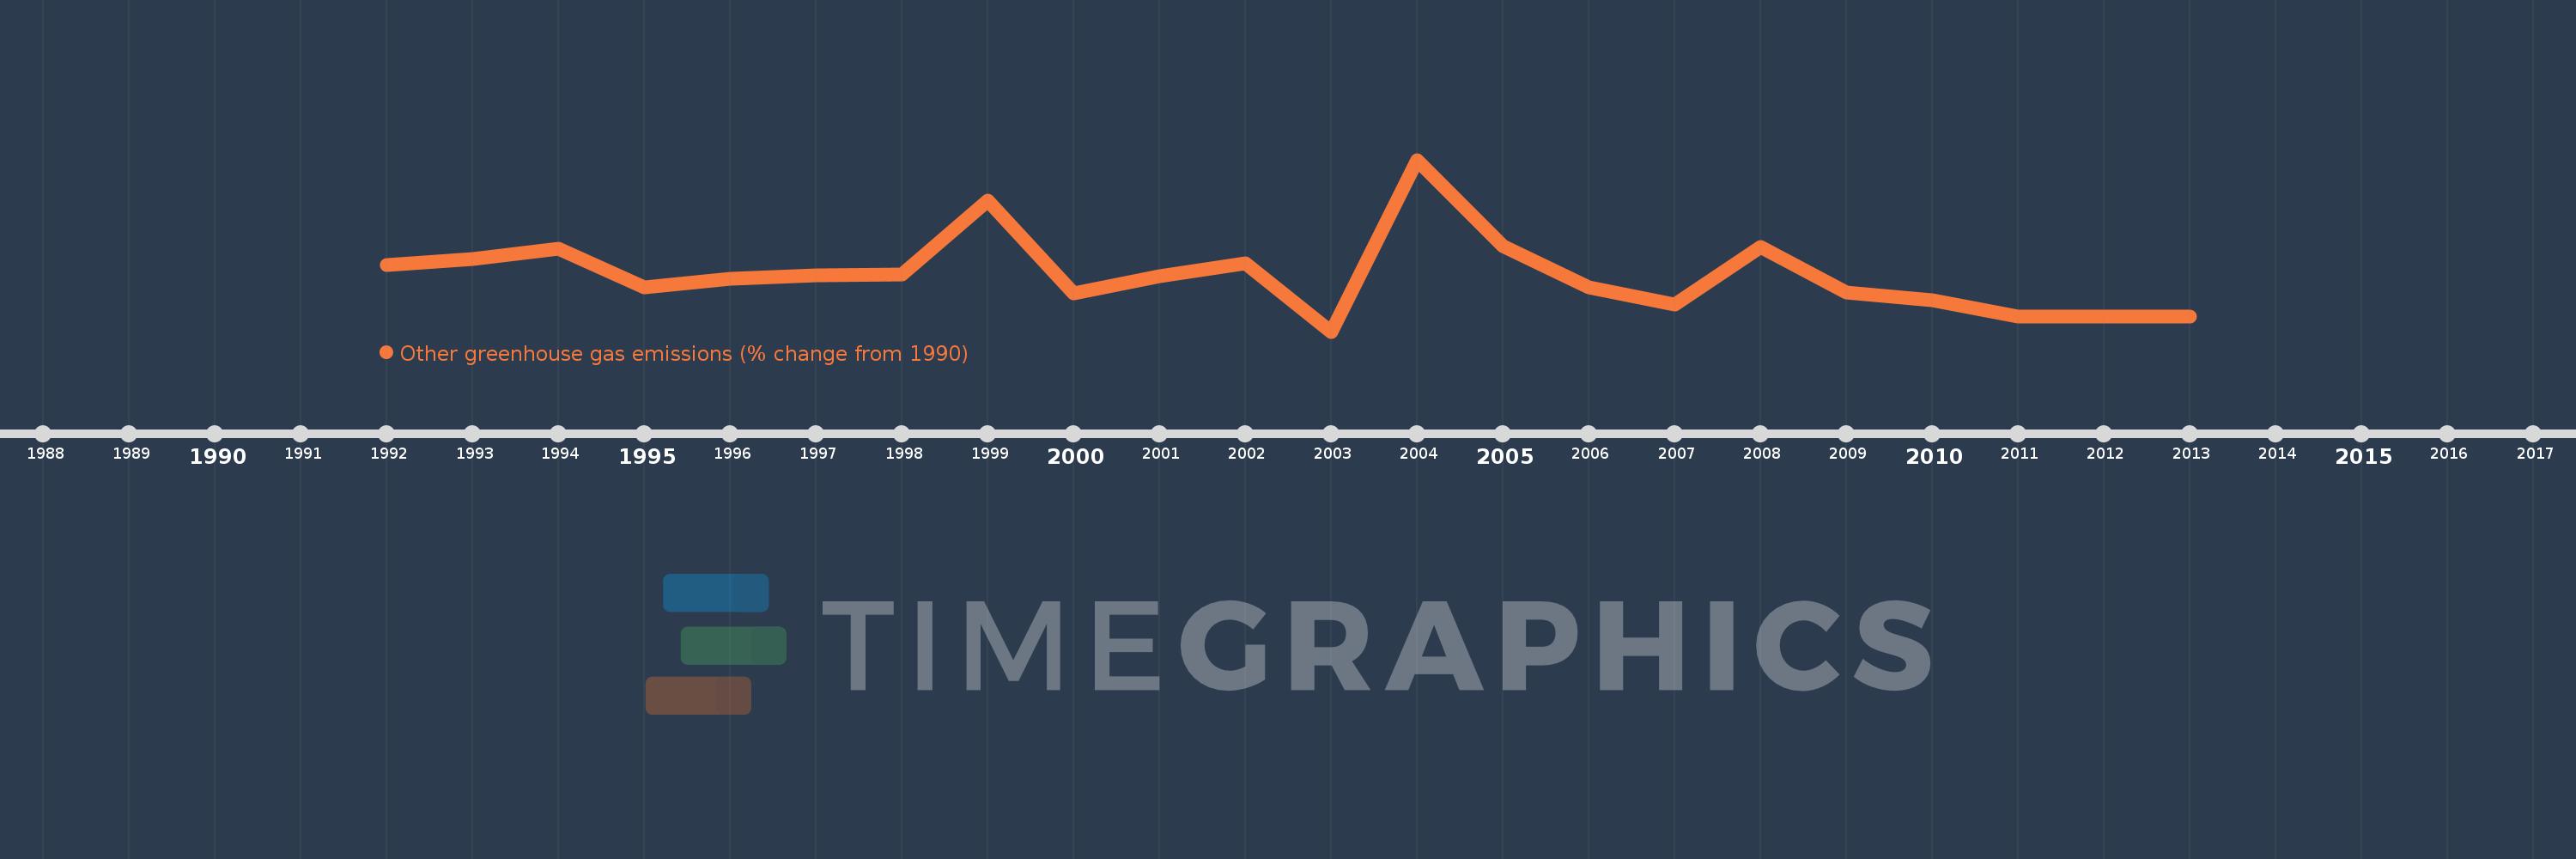
This timeline shows a graph from 1992 to 2013 of Venezuela, RB. No data until 1991. Number of actual observations by date: 22.
Source name:
World Development Indicators
Source organization:
World Bank staff estimates from original source: European Commission, Joint Research Centre (JRC)/Netherlands Environmental Assessment Agency (PBL). Emission Database for Global Atmospheric Research (EDGAR): http://edgar.jrc.ec.europa.eu/.
Categories, topics:
Climate Change, Environment
Last updated:
apr 23, 2017
Indicators value changes by year
Meaning:
-11.875
Minimum:
-53.286
jan 1, 2003
Maximum:
71.422
jan 1, 2004
At the date of observation
Value
Absolute change
Change from the previous value
jan 1, 1992
-4.672
-4.672
0.0%
jan 1, 1993
-0.562
+4.111
-87.98%
jan 1, 1994
7.149
+7.711
-1.37K%
jan 1, 1995
-21.413
-28.563
-399.52%
jan 1, 1996
-14.746
+6.667
-31.14%
jan 1, 1997
-12.361
+2.385
-16.18%
jan 1, 1998
-11.697
+0.664
-5.37%
jan 1, 1999
41.988
+53.684
-458.97%
jan 1, 2000
-25.641
-67.629
-161.07%
jan 1, 2001
-12.951
+12.69
-49.49%
jan 1, 2002
-3.616
+9.335
-72.08%
jan 1, 2003
-53.286
-49.67
1.37K%
jan 1, 2004
71.422
+124.707
-234.03%
jan 1, 2005
8.924
-62.497
-87.5%
jan 1, 2006
-21.382
-30.306
-339.59%
jan 1, 2007
-33.589
-12.208
57.09%
jan 1, 2008
7.91
+41.5
-123.55%
jan 1, 2009
-25.125
-33.035
-417.63%
jan 1, 2010
-30.331
-5.206
20.72%
jan 1, 2011
-42.425
-12.094
39.87%
jan 1, 2012
-42.425
0.0
0.0%
jan 1, 2013
-42.425
0.0
0.0%
Ranking of countries by current statistics by years