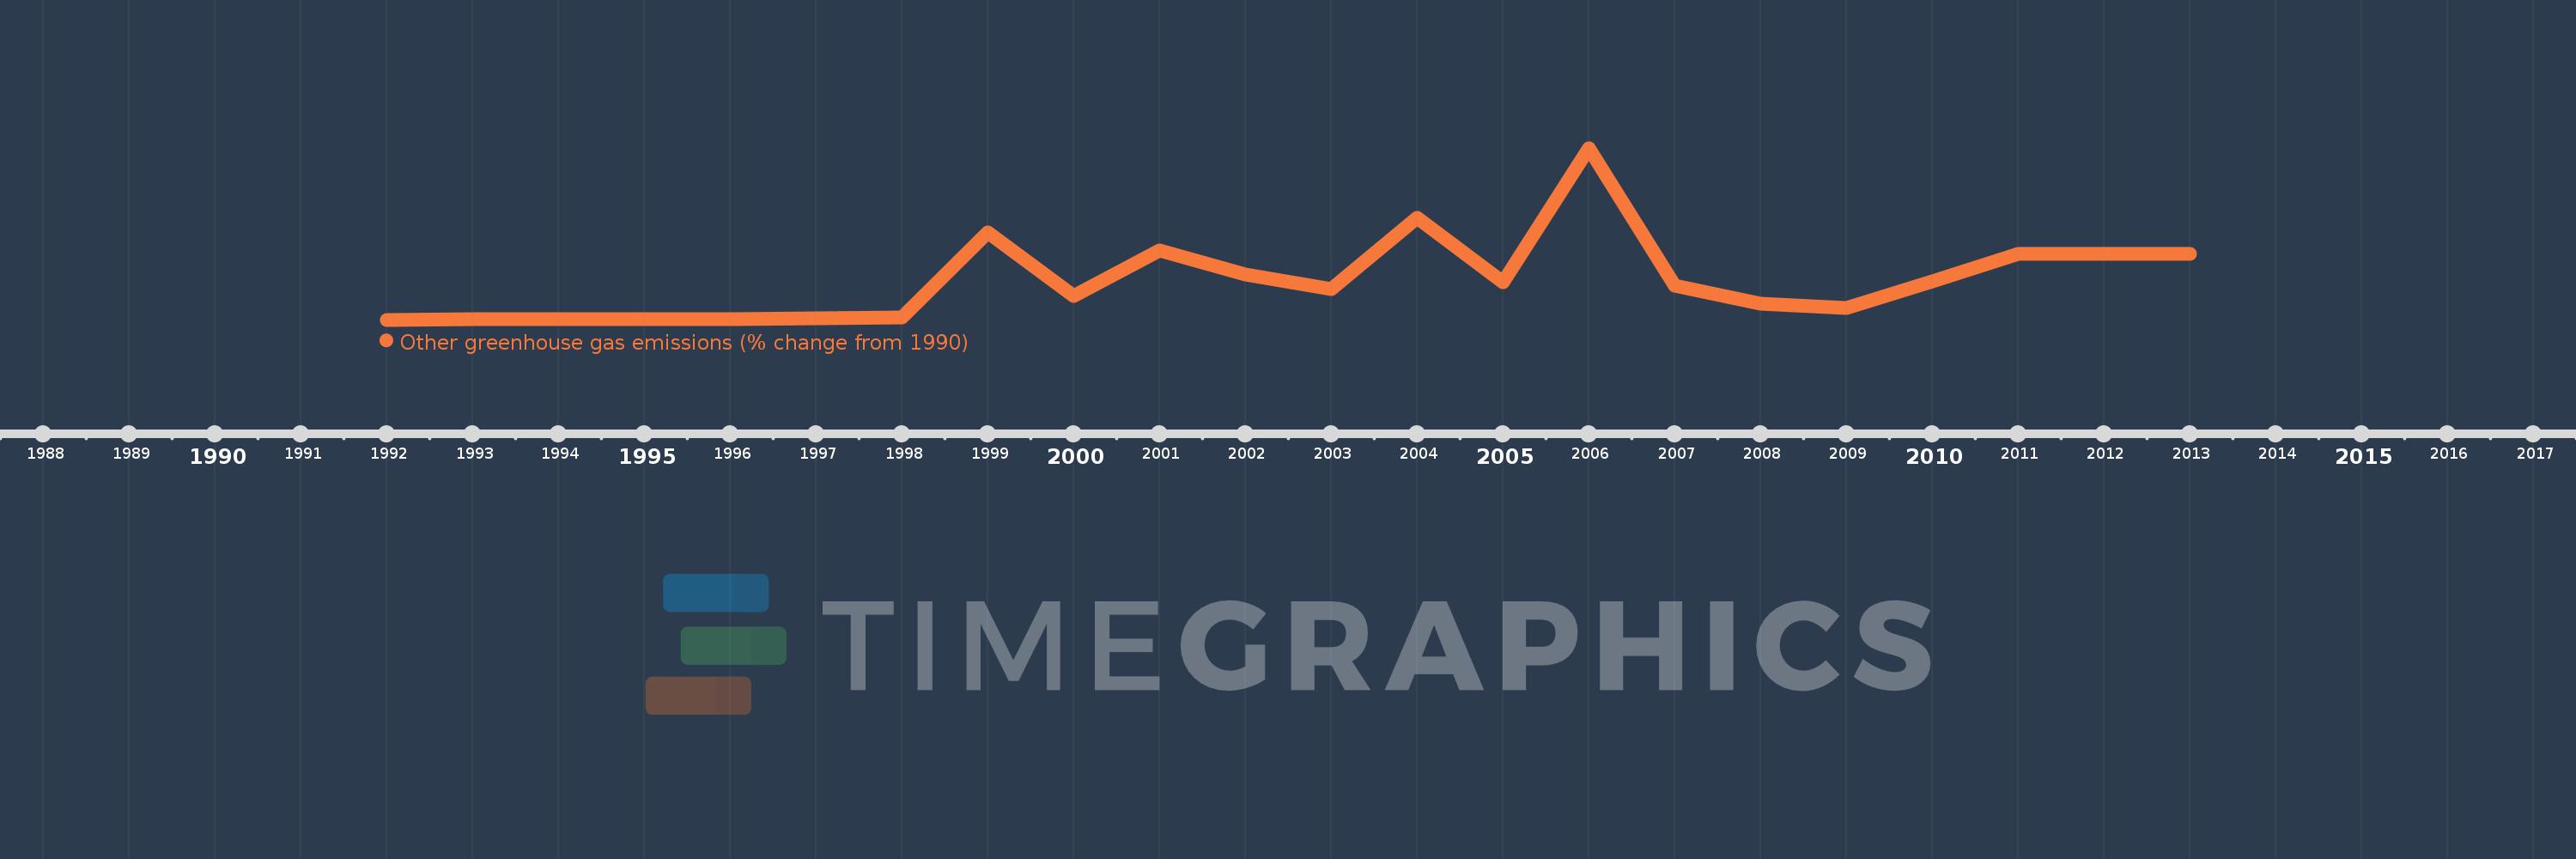
This timeline shows a graph from 1992 to 2013 of Portugal. No data until 1991. Number of actual observations by date: 22.
Source name:
World Development Indicators
Source organization:
World Bank staff estimates from original source: European Commission, Joint Research Centre (JRC)/Netherlands Environmental Assessment Agency (PBL). Emission Database for Global Atmospheric Research (EDGAR): http://edgar.jrc.ec.europa.eu/.
Categories, topics:
Climate Change, Environment
Last updated:
apr 23, 2017
Indicators value changes by year
Meaning:
2.015K
Minimum:
-1.956
jan 1, 1992
Maximum:
8.74K
jan 1, 2006
At the date of observation
Value
Absolute change
Change from the previous value
jan 1, 1992
-1.956
-1.956
0.0%
jan 1, 1993
9.007
+10.963
-560.34%
jan 1, 1994
7.373
-1.634
-18.14%
jan 1, 1995
21.926
+14.553
197.4%
jan 1, 1996
45.626
+23.7
108.09%
jan 1, 1997
74.32
+28.694
62.89%
jan 1, 1998
101.628
+27.308
36.74%
jan 1, 1999
4.442K
+4.34K
4.27K%
jan 1, 2000
1.204K
-3.238K
-72.89%
jan 1, 2001
3.515K
+2.311K
191.87%
jan 1, 2002
2.297K
-1.217K
-34.63%
jan 1, 2003
1.569K
-728.568
-31.71%
jan 1, 2004
5.203K
+3.634K
231.63%
jan 1, 2005
1.899K
-3.304K
-63.5%
jan 1, 2006
8.74K
+6.841K
360.24%
jan 1, 2007
1.742K
-6.998K
-80.07%
jan 1, 2008
799.054
-943.222
-54.14%
jan 1, 2009
614.373
-184.681
-23.11%
jan 1, 2010
1.936K
+1.322K
215.18%
jan 1, 2011
3.371K
+1.434K
74.06%
jan 1, 2012
3.371K
+0.0
0.0%
jan 1, 2013
3.371K
0.0
0.0%
Ranking of countries by current statistics by years