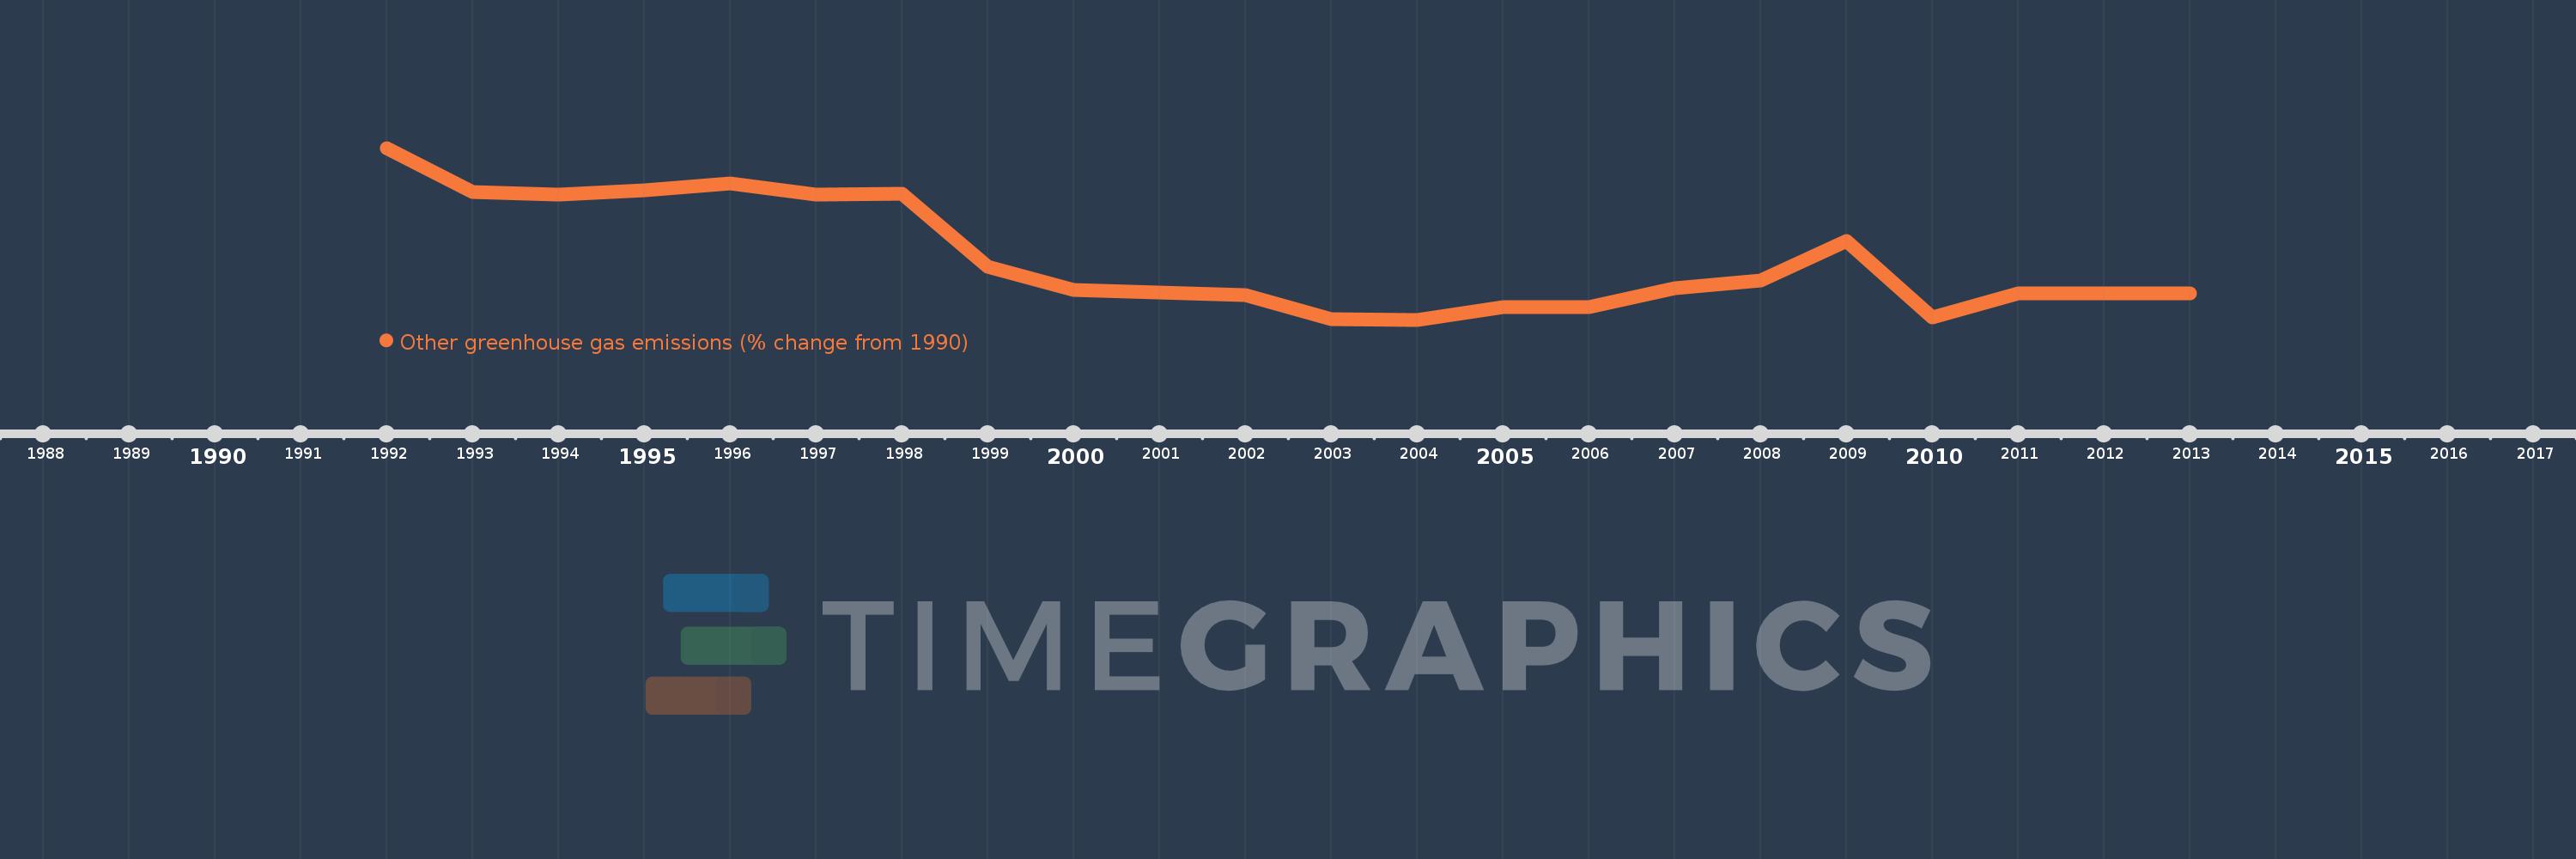
This timeline shows a graph from 1992 to 2013 of Romania. No data until 1991. Number of actual observations by date: 22.
Source name:
World Development Indicators
Source organization:
World Bank staff estimates from original source: European Commission, Joint Research Centre (JRC)/Netherlands Environmental Assessment Agency (PBL). Emission Database for Global Atmospheric Research (EDGAR): http://edgar.jrc.ec.europa.eu/.
Categories, topics:
Climate Change, Environment
Last updated:
apr 23, 2017
Indicators value changes by year
Meaning:
-53.234
Minimum:
-79.199
jan 1, 2004
Maximum:
-5.58
jan 1, 1992
At the date of observation
Value
Absolute change
Change from the previous value
jan 1, 1992
-5.58
-5.58
0.0%
jan 1, 1993
-24.301
-18.721
335.48%
jan 1, 1994
-25.487
-1.186
4.88%
jan 1, 1995
-23.571
+1.916
-7.52%
jan 1, 1996
-20.965
+2.606
-11.06%
jan 1, 1997
-25.459
-4.494
21.44%
jan 1, 1998
-25.218
+0.241
-0.95%
jan 1, 1999
-56.47
-31.252
123.93%
jan 1, 2000
-66.36
-9.891
17.51%
jan 1, 2001
-67.618
-1.258
1.9%
jan 1, 2002
-68.618
-1.001
1.48%
jan 1, 2003
-79.073
-10.454
15.24%
jan 1, 2004
-79.199
-0.127
0.16%
jan 1, 2005
-73.971
+5.228
-6.6%
jan 1, 2006
-73.794
+0.178
-0.24%
jan 1, 2007
-65.77
+8.024
-10.87%
jan 1, 2008
-62.324
+3.445
-5.24%
jan 1, 2009
-45.481
+16.844
-27.03%
jan 1, 2010
-78.131
-32.65
71.79%
jan 1, 2011
-67.921
+10.21
-13.07%
jan 1, 2012
-67.921
0.0
0.0%
jan 1, 2013
-67.921
0.0
0.0%
Ranking of countries by current statistics by years