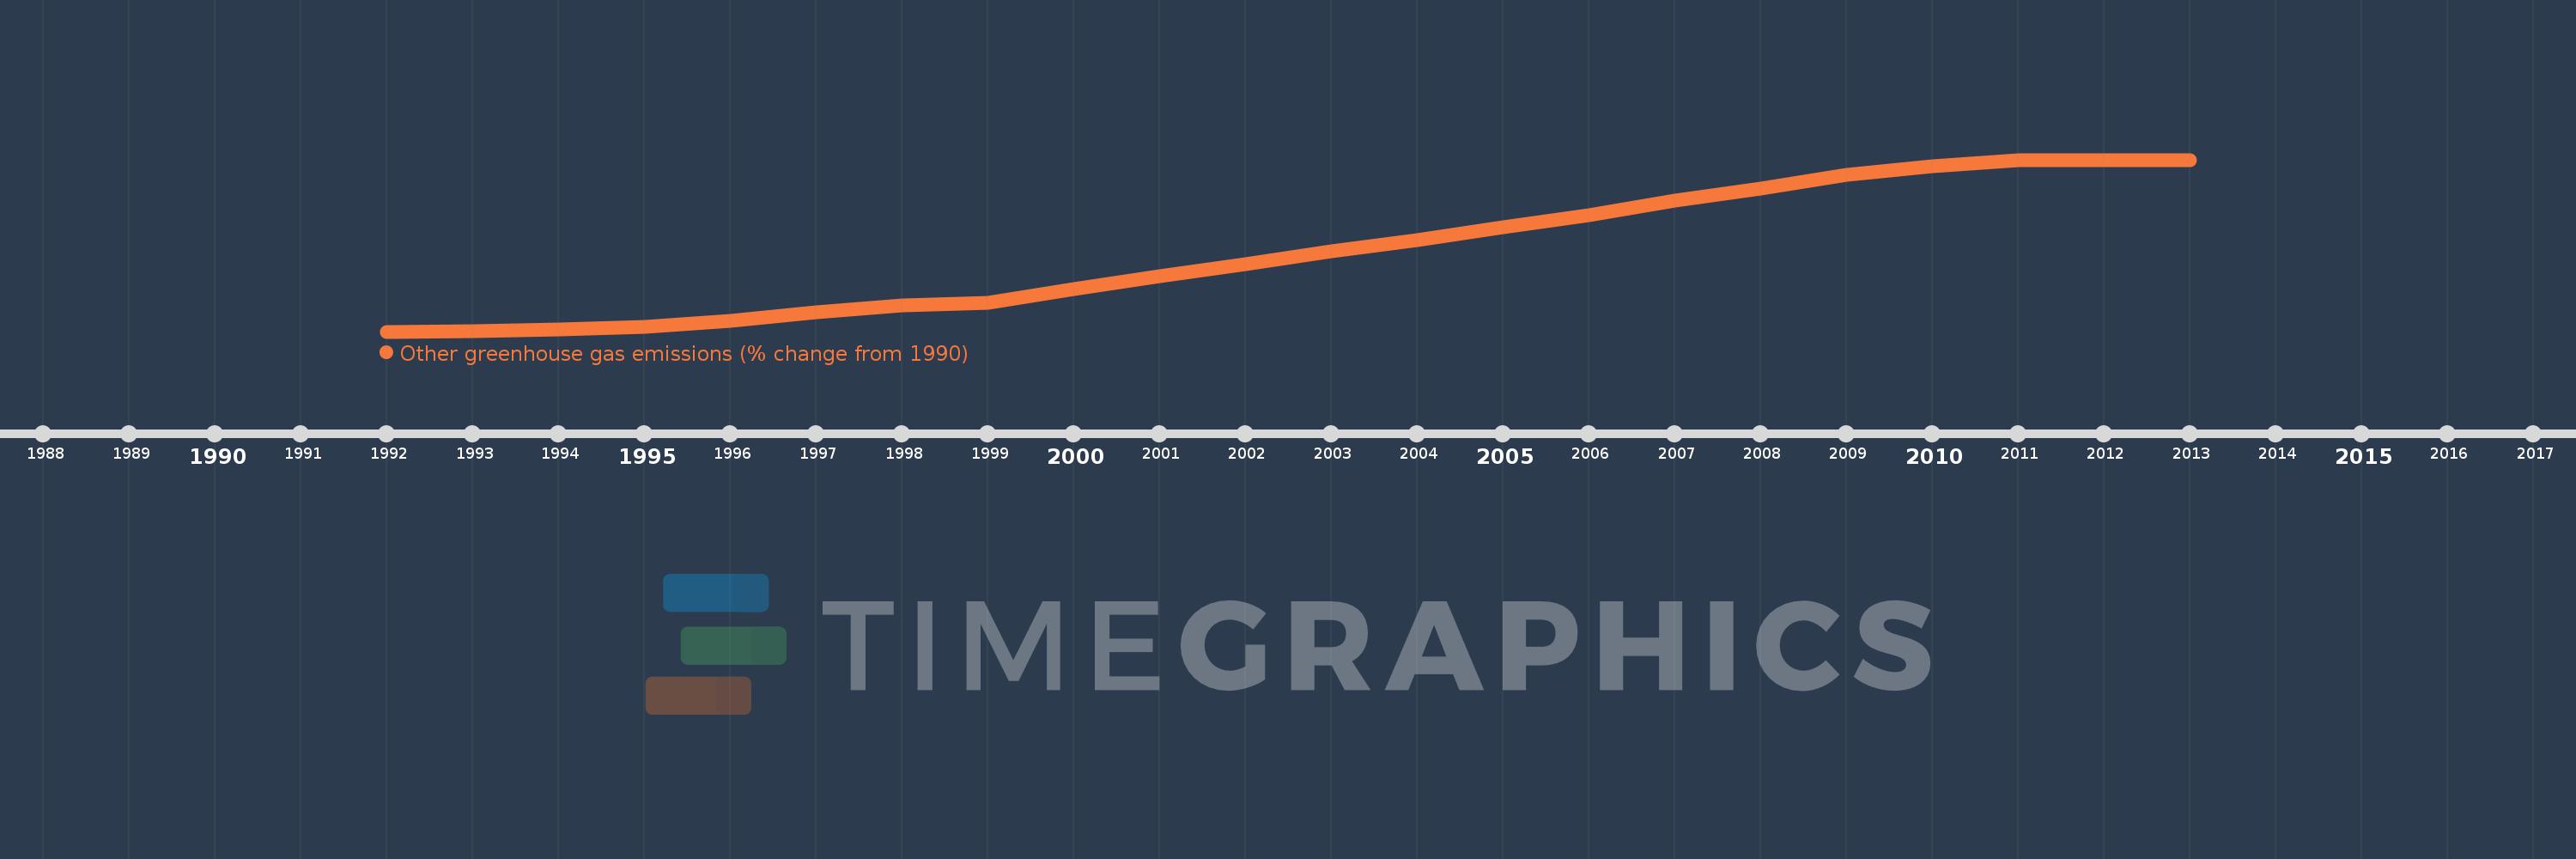
This timeline shows a graph from 1992 to 2013 of Luxembourg. No data until 1991. Number of actual observations by date: 22.
Source name:
World Development Indicators
Source organization:
World Bank staff estimates from original source: European Commission, Joint Research Centre (JRC)/Netherlands Environmental Assessment Agency (PBL). Emission Database for Global Atmospheric Research (EDGAR): http://edgar.jrc.ec.europa.eu/.
Categories, topics:
Climate Change, Environment
Last updated:
apr 23, 2017
Indicators value changes by year
Meaning:
908.453
Minimum:
-0.029
jan 1, 1992
Maximum:
1.949K
jan 1, 2013
At the date of observation
Value
Absolute change
Change from the previous value
jan 1, 1992
-0.029
-0.029
0.0%
jan 1, 1993
2.709
+2.738
-9.44K%
jan 1, 1994
21.373
+18.663
688.9%
jan 1, 1995
55.92
+34.547
161.64%
jan 1, 1996
126.476
+70.556
126.17%
jan 1, 1997
217.626
+91.149
72.07%
jan 1, 1998
296.726
+79.1
36.35%
jan 1, 1999
329.356
+32.631
11.0%
jan 1, 2000
477.707
+148.351
45.04%
jan 1, 2001
630.754
+153.046
32.04%
jan 1, 2002
766.841
+136.088
21.58%
jan 1, 2003
907.274
+140.433
18.31%
jan 1, 2004
1.036K
+129.22
14.24%
jan 1, 2005
1.182K
+145.898
14.08%
jan 1, 2006
1.317K
+134.826
11.4%
jan 1, 2007
1.486K
+168.323
12.78%
jan 1, 2008
1.626K
+140.433
9.45%
jan 1, 2009
1.78K
+154.308
9.49%
jan 1, 2010
1.879K
+98.387
5.53%
jan 1, 2011
1.949K
+70.216
3.74%
jan 1, 2012
1.949K
0.0
0.0%
jan 1, 2013
1.949K
+0.0
0.0%
Ranking of countries by current statistics by years