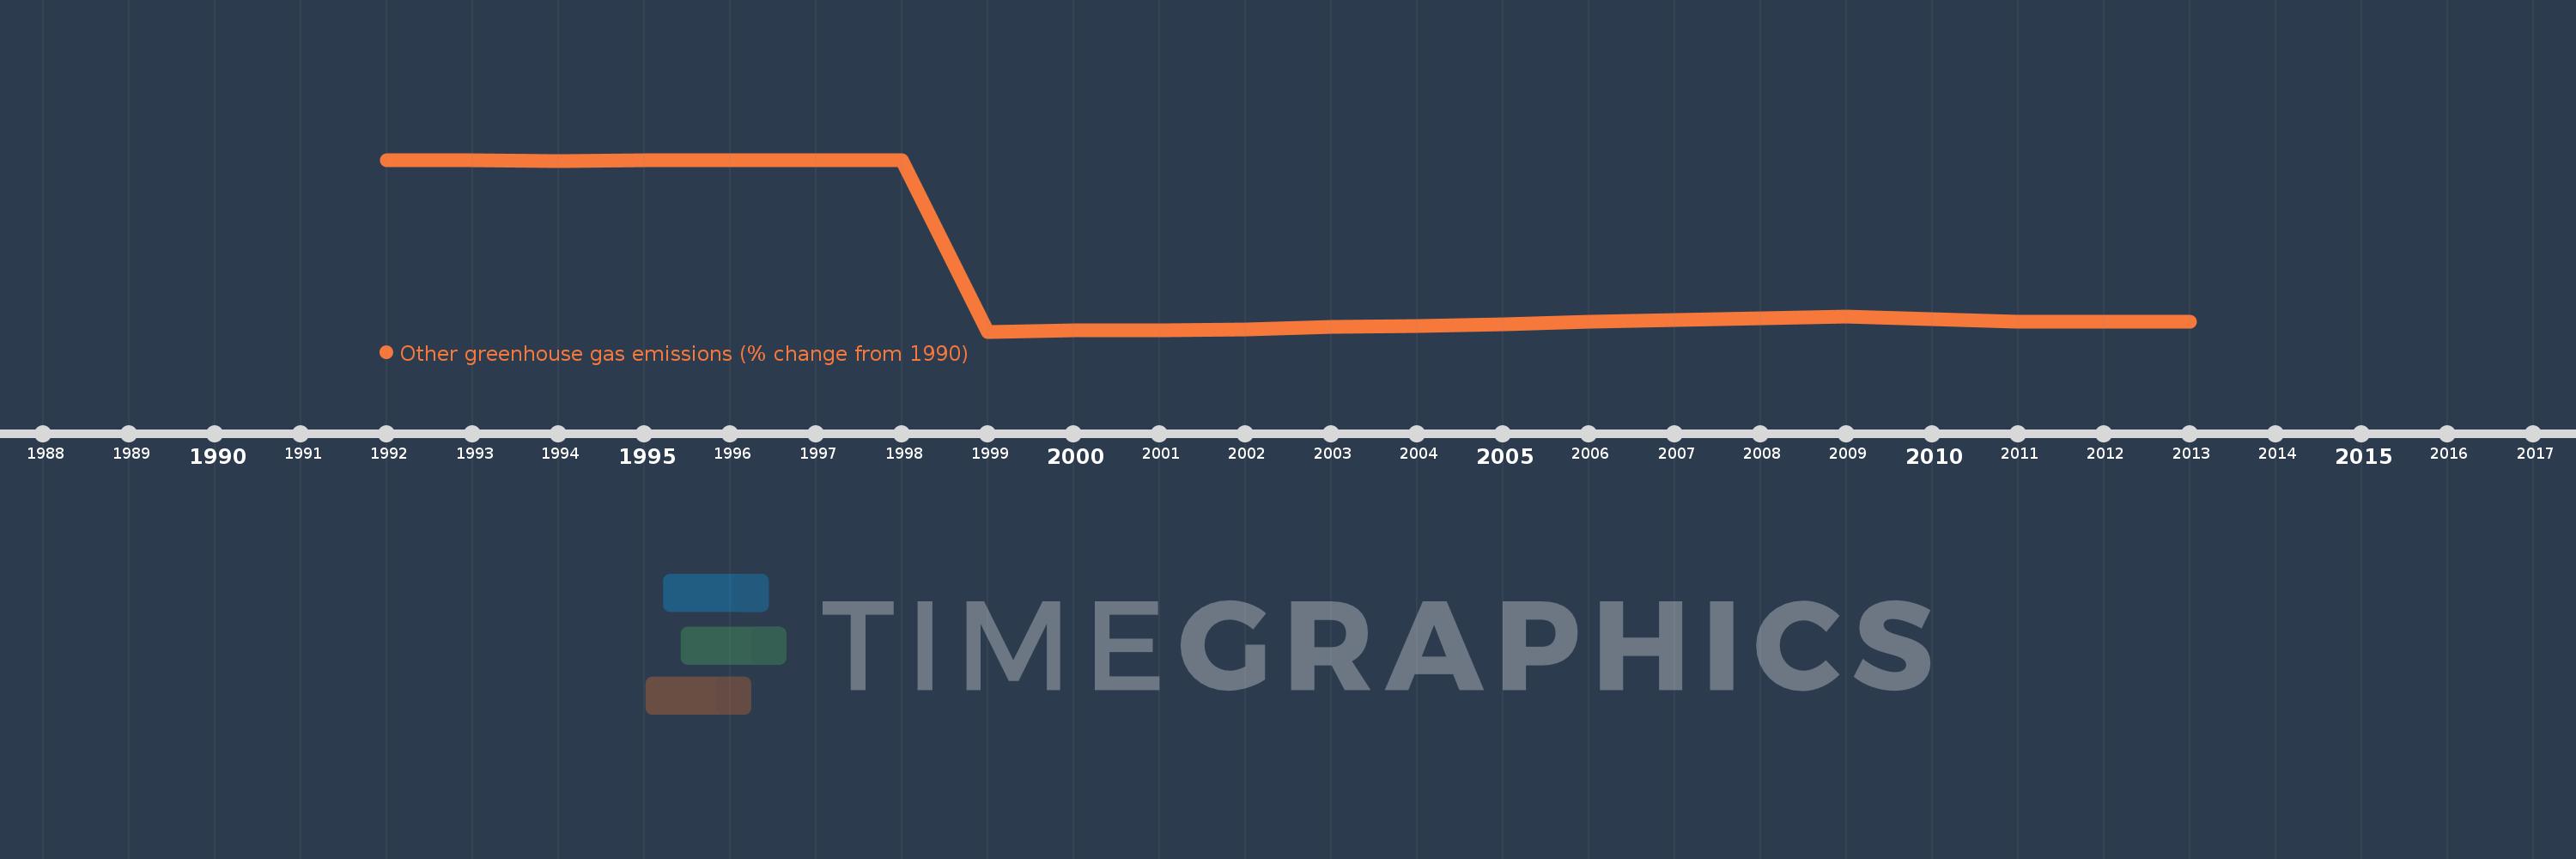
This timeline shows a graph from 1992 to 2013 of Poland. No data until 1991. Number of actual observations by date: 22.
Source name:
World Development Indicators
Source organization:
World Bank staff estimates from original source: European Commission, Joint Research Centre (JRC)/Netherlands Environmental Assessment Agency (PBL). Emission Database for Global Atmospheric Research (EDGAR): http://edgar.jrc.ec.europa.eu/.
Categories, topics:
Climate Change, Environment
Last updated:
apr 23, 2017
Indicators value changes by year
Meaning:
-62.228
Minimum:
-95.295
jan 1, 1999
Maximum:
-0.101
jan 1, 1998
At the date of observation
Value
Absolute change
Change from the previous value
jan 1, 1992
-0.24
-0.24
0.0%
jan 1, 1993
-0.423
-0.183
76.18%
jan 1, 1994
-0.582
-0.16
37.73%
jan 1, 1995
-0.573
+0.01
-1.69%
jan 1, 1996
-0.25
+0.322
-56.3%
jan 1, 1997
-0.292
-0.042
16.7%
jan 1, 1998
-0.101
+0.191
-65.33%
jan 1, 1999
-95.295
-95.194
94.05K%
jan 1, 2000
-94.818
+0.477
-0.5%
jan 1, 2001
-94.481
+0.337
-0.36%
jan 1, 2002
-94.104
+0.376
-0.4%
jan 1, 2003
-92.602
+1.503
-1.6%
jan 1, 2004
-92.342
+0.259
-0.28%
jan 1, 2005
-91.261
+1.082
-1.17%
jan 1, 2006
-89.892
+1.369
-1.5%
jan 1, 2007
-88.95
+0.941
-1.05%
jan 1, 2008
-87.937
+1.013
-1.14%
jan 1, 2009
-87.041
+0.896
-1.02%
jan 1, 2010
-88.418
-1.377
1.58%
jan 1, 2011
-89.806
-1.388
1.57%
jan 1, 2012
-89.806
0.0
0.0%
jan 1, 2013
-89.806
0.0
0.0%
Ranking of countries by current statistics by years