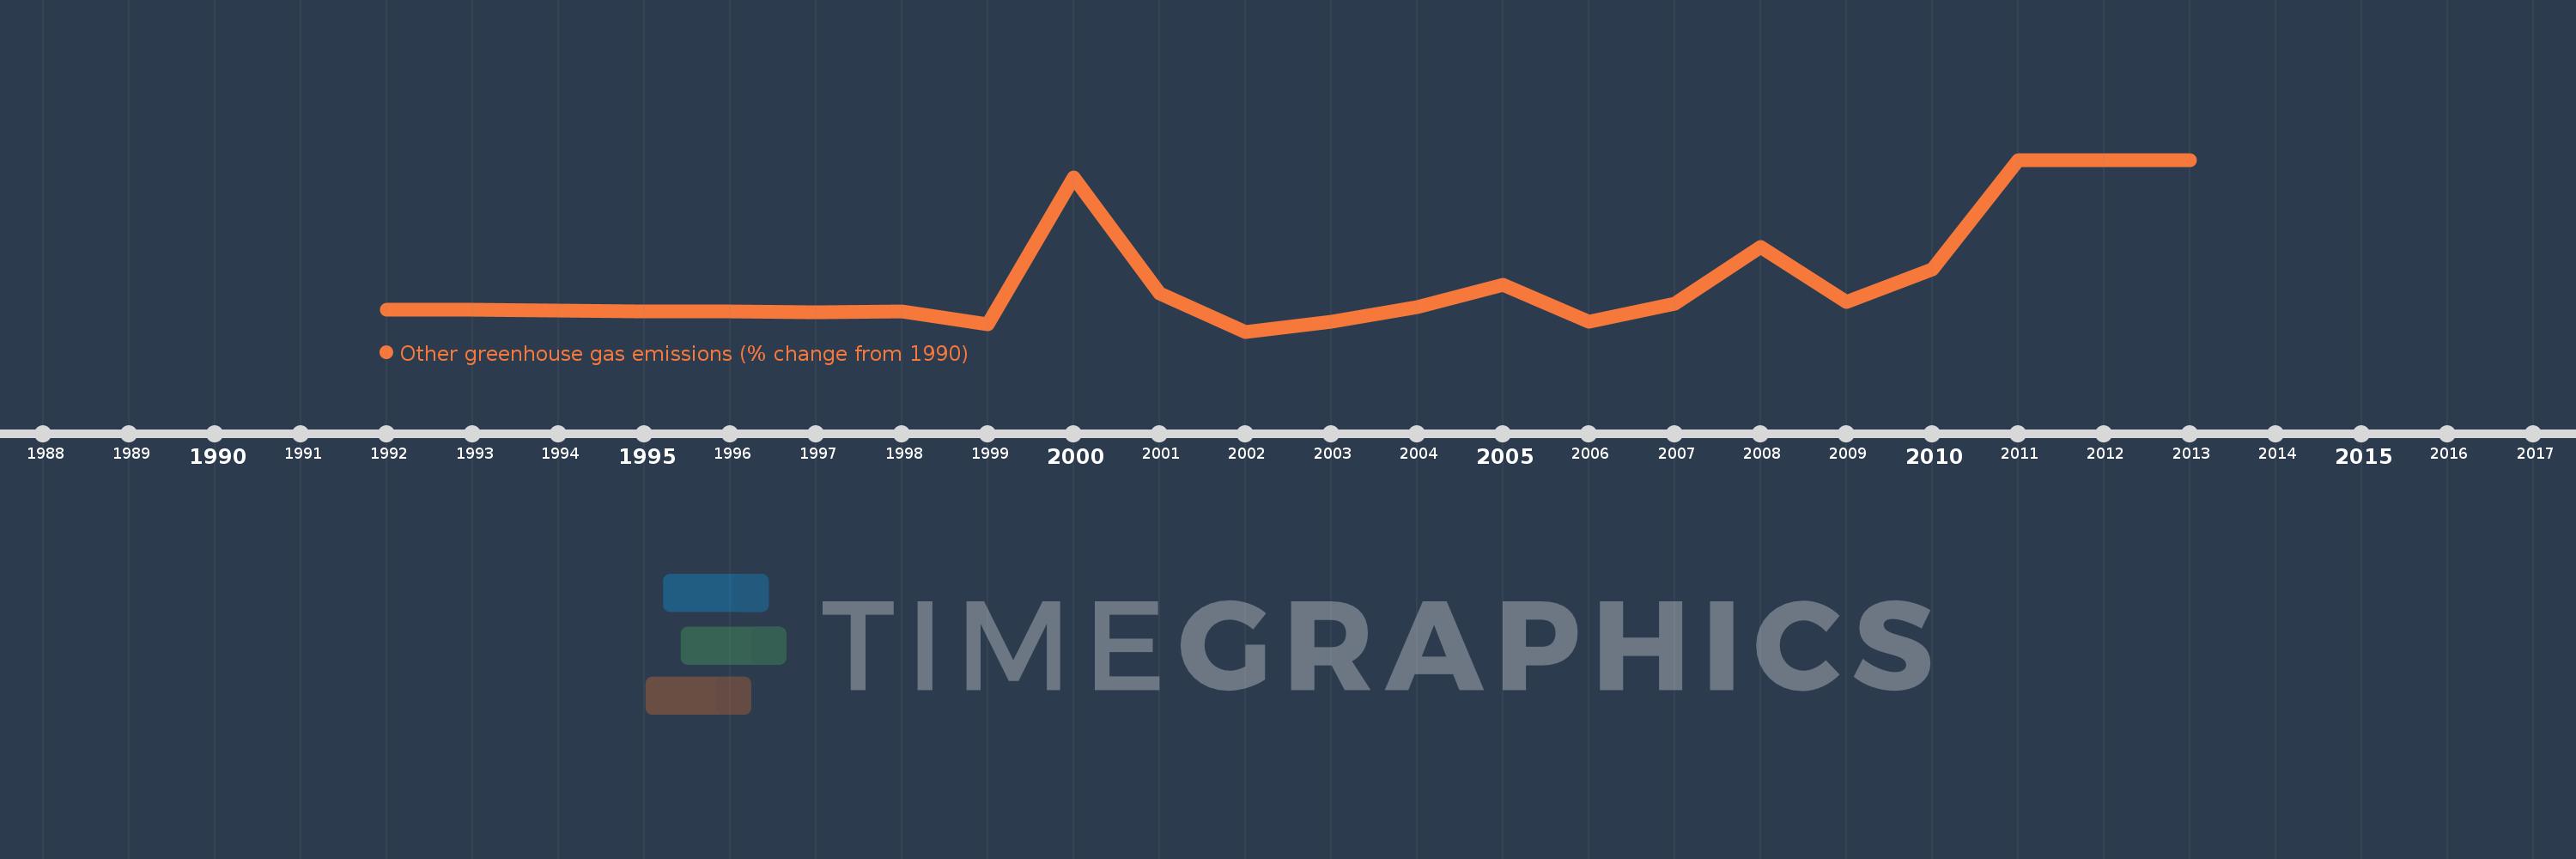
This timeline shows a graph from 1992 to 2013 of India. No data until 1991. Number of actual observations by date: 22.
Source name:
World Development Indicators
Source organization:
World Bank staff estimates from original source: European Commission, Joint Research Centre (JRC)/Netherlands Environmental Assessment Agency (PBL). Emission Database for Global Atmospheric Research (EDGAR): http://edgar.jrc.ec.europa.eu/.
Categories, topics:
Climate Change, Environment
Last updated:
apr 23, 2017
Indicators value changes by year
Meaning:
50.106
Minimum:
-34.807
jan 1, 2002
Maximum:
243.275
jan 1, 2013
At the date of observation
Value
Absolute change
Change from the previous value
jan 1, 1992
1.117
+1.117
0.0%
jan 1, 1993
0.089
-1.028
-92.0%
jan 1, 1994
-0.626
-0.715
-800.0%
jan 1, 1995
-2.1
-1.474
235.71%
jan 1, 1996
-2.591
-0.491
23.4%
jan 1, 1997
-3.172
-0.581
22.41%
jan 1, 1998
-2.122
+1.05
-33.1%
jan 1, 1999
-23.653
-21.531
1.01K%
jan 1, 2000
214.247
+237.9
-1.01K%
jan 1, 2001
26.504
-187.743
-87.63%
jan 1, 2002
-34.807
-61.311
-231.33%
jan 1, 2003
-19.488
+15.319
-44.01%
jan 1, 2004
4.404
+23.893
-122.6%
jan 1, 2005
41.109
+36.705
833.38%
jan 1, 2006
-19.09
-60.2
-146.44%
jan 1, 2007
10.707
+29.797
-156.09%
jan 1, 2008
102.158
+91.451
854.12%
jan 1, 2009
13.412
-88.745
-86.87%
jan 1, 2010
66.413
+53.001
395.17%
jan 1, 2011
243.275
+176.863
266.31%
jan 1, 2012
243.275
0.0
0.0%
jan 1, 2013
243.275
+0.0
0.0%
Ranking of countries by current statistics by years