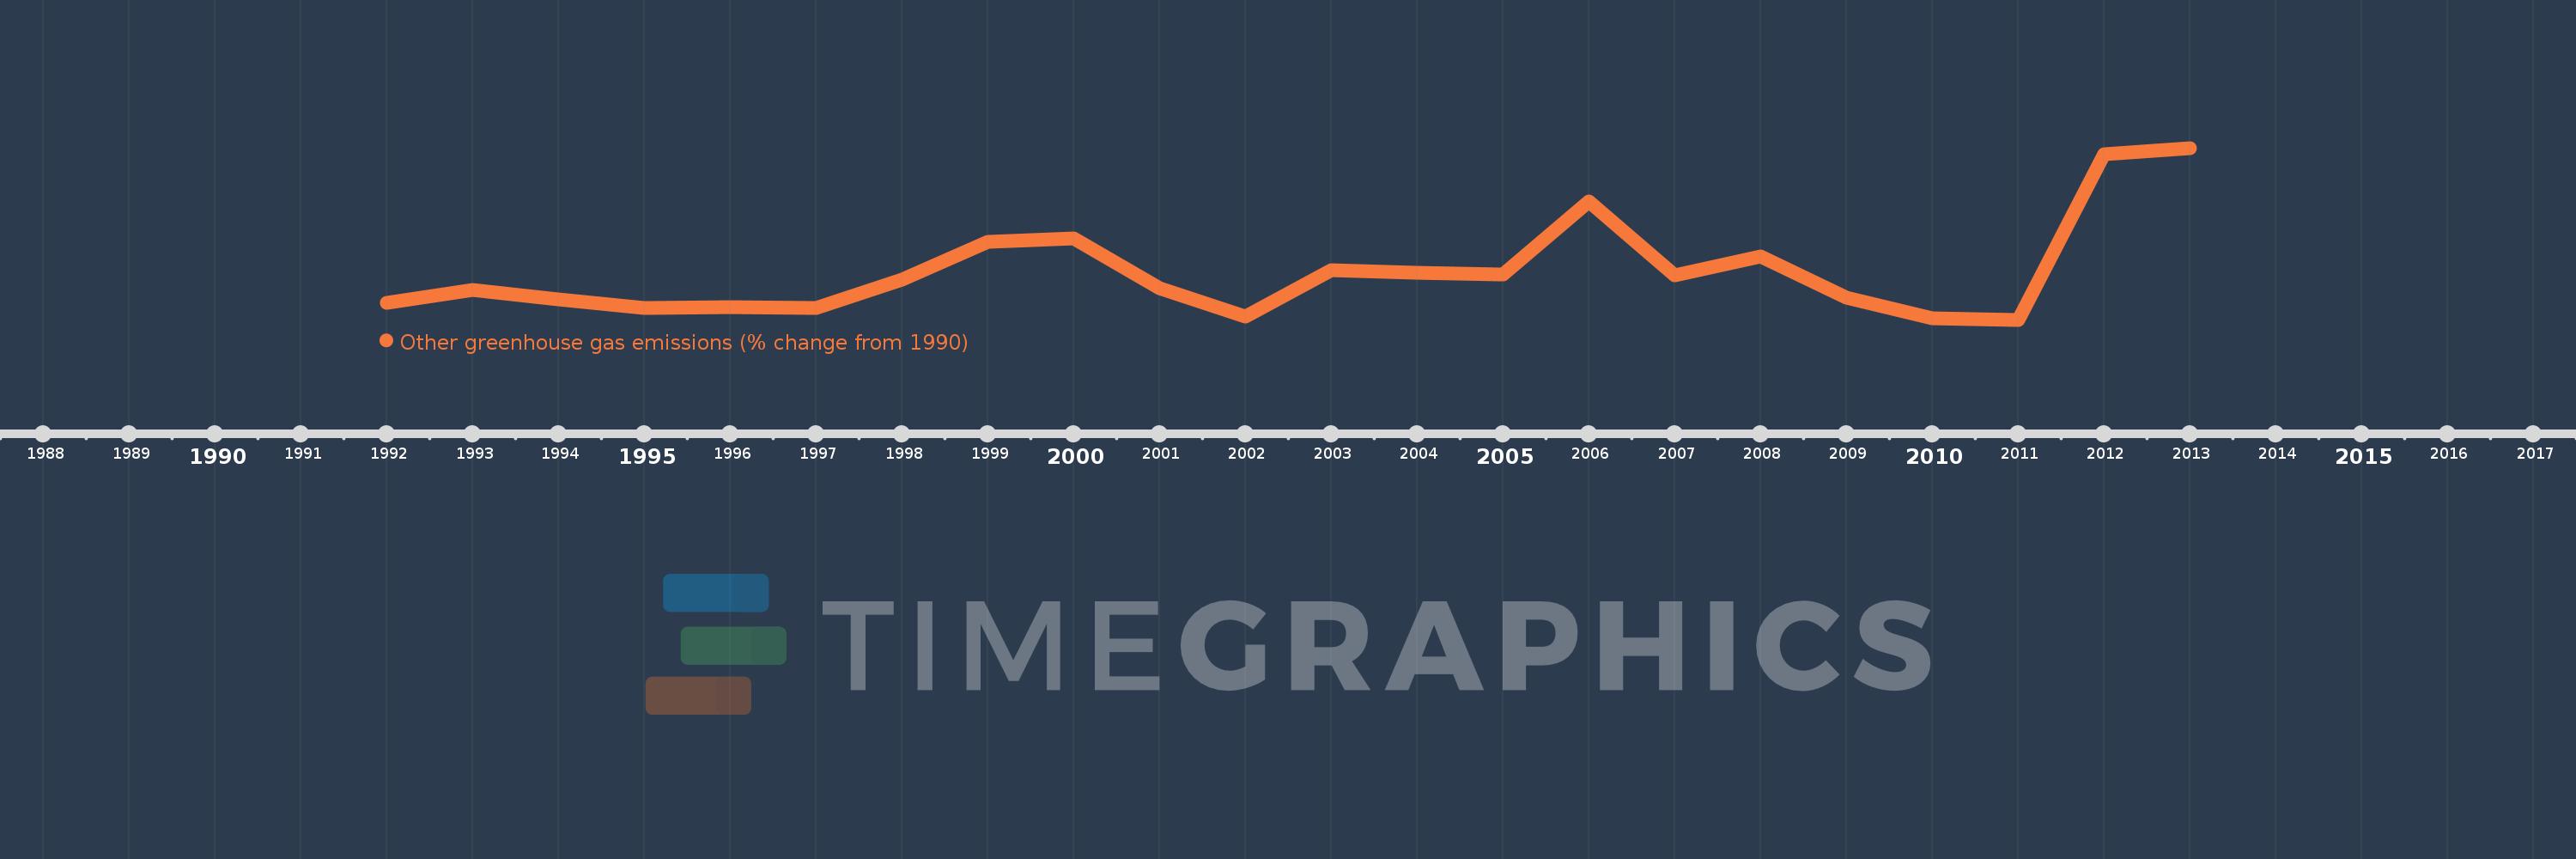
This timeline shows a graph from 1992 to 2013 of IDA blend. No data until 1991. Number of actual observations by date: 22.
Source name:
World Development Indicators
Source organization:
World Bank staff estimates from original source: European Commission, Joint Research Centre (JRC)/Netherlands Environmental Assessment Agency (PBL). Emission Database for Global Atmospheric Research (EDGAR): http://edgar.jrc.ec.europa.eu/.
Categories, topics:
Climate Change, Environment
Last updated:
apr 23, 2017
Indicators value changes by year
Meaning:
27.583
Minimum:
-17.722
jan 1, 2011
Maximum:
142.888
jan 1, 2013
At the date of observation
Value
Absolute change
Change from the previous value
jan 1, 1992
-1.582
-1.582
0.0%
jan 1, 1993
10.376
+11.958
-755.85%
jan 1, 1994
1.134
-9.242
-89.07%
jan 1, 1995
-6.345
-7.479
-659.57%
jan 1, 1996
-6.008
+0.338
-5.32%
jan 1, 1997
-6.921
-0.913
15.2%
jan 1, 1998
19.509
+26.43
-381.88%
jan 1, 1999
54.789
+35.28
180.84%
jan 1, 2000
58.53
+3.741
6.83%
jan 1, 2001
11.52
-47.01
-80.32%
jan 1, 2002
-14.627
-26.147
-226.97%
jan 1, 2003
28.882
+43.509
-297.46%
jan 1, 2004
26.506
-2.376
-8.23%
jan 1, 2005
24.62
-1.885
-7.11%
jan 1, 2006
92.712
+68.092
276.57%
jan 1, 2007
23.862
-68.85
-74.26%
jan 1, 2008
41.368
+17.506
73.36%
jan 1, 2009
3.094
-38.274
-92.52%
jan 1, 2010
-16.661
-19.755
-638.47%
jan 1, 2011
-17.722
-1.061
6.37%
jan 1, 2012
136.91
+154.632
-872.54%
jan 1, 2013
142.888
+5.979
4.37%
Ranking of countries by current statistics by years