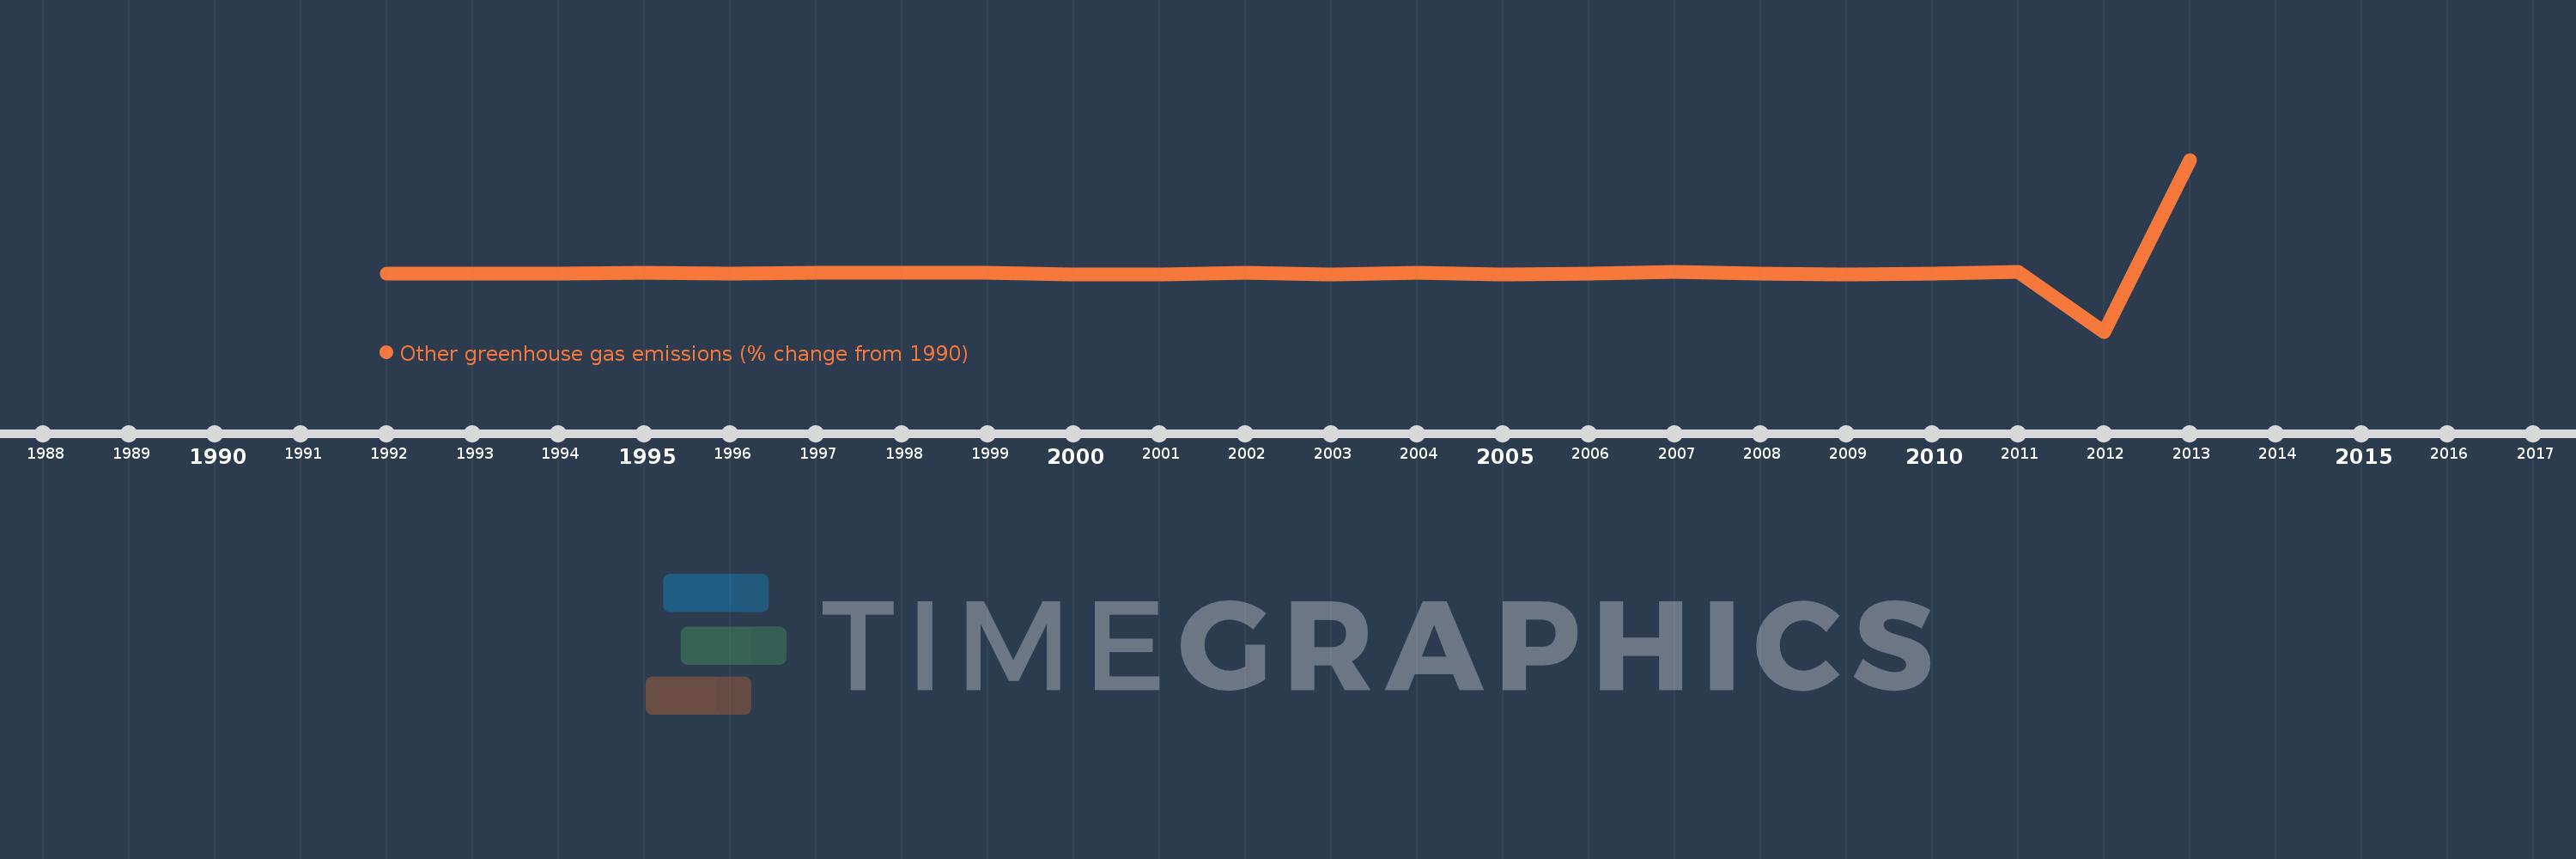
This timeline shows a graph from 1992 to 2013 of Qatar. No data until 1991. Number of actual observations by date: 22.
Source name:
World Development Indicators
Source organization:
World Bank staff estimates from original source: European Commission, Joint Research Centre (JRC)/Netherlands Environmental Assessment Agency (PBL). Emission Database for Global Atmospheric Research (EDGAR): http://edgar.jrc.ec.europa.eu/.
Categories, topics:
Climate Change, Environment
Last updated:
apr 23, 2017
Indicators value changes by year
Meaning:
361.995
Minimum:
-10.069K
jan 1, 2012
Maximum:
19.497K
jan 1, 2013
At the date of observation
Value
Absolute change
Change from the previous value
jan 1, 1992
-33.333
-33.333
0.0%
jan 1, 1993
-144.444
-111.111
333.33%
jan 1, 1994
-133.333
+11.111
-7.69%
jan 1, 1995
-11.111
+122.222
-91.67%
jan 1, 1996
-144.444
-133.333
1.2K%
jan 1, 1997
-11.111
+133.333
-92.31%
jan 1, 1998
77.778
+88.889
-800.0%
jan 1, 1999
-11.111
-88.889
-114.29%
jan 1, 2000
-188.889
-177.778
1.6K%
jan 1, 2001
-277.778
-88.889
47.06%
jan 1, 2002
-5.556
+272.222
-98.0%
jan 1, 2003
-245.833
-240.278
4.33K%
jan 1, 2004
61.111
+306.944
-124.86%
jan 1, 2005
-206.944
-268.056
-438.64%
jan 1, 2006
-158.333
+48.611
-23.49%
jan 1, 2007
216.667
+375.0
-236.84%
jan 1, 2008
-33.333
-250.0
-115.38%
jan 1, 2009
-263.889
-230.556
691.67%
jan 1, 2010
-136.111
+127.778
-48.42%
jan 1, 2011
186.111
+322.222
-236.73%
jan 1, 2012
-10.069K
-10.256K
-5.51K%
jan 1, 2013
19.497K
+29.567K
-293.63%
Ranking of countries by current statistics by years