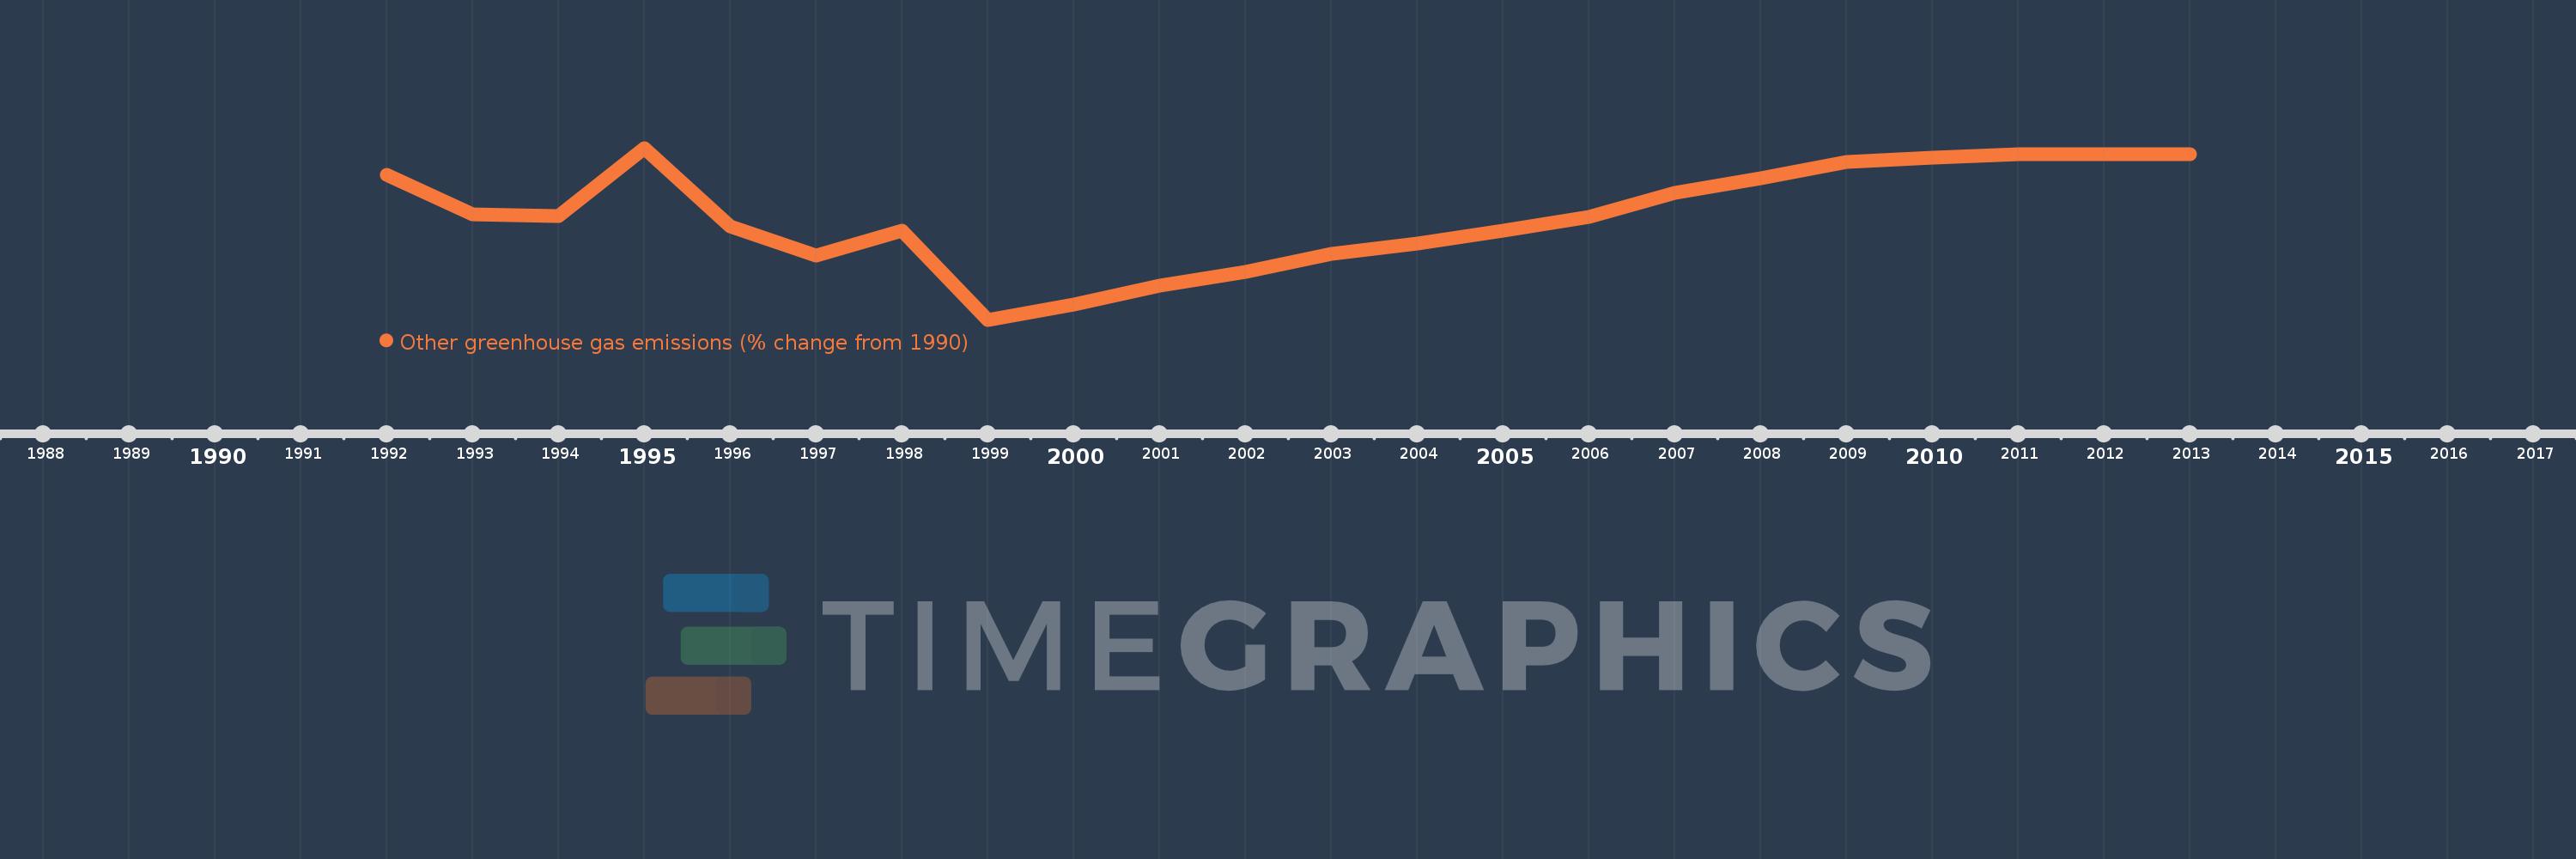
This timeline shows a graph from 1992 to 2013 of Switzerland. No data until 1991. Number of actual observations by date: 22.
Source name:
World Development Indicators
Source organization:
World Bank staff estimates from original source: European Commission, Joint Research Centre (JRC)/Netherlands Environmental Assessment Agency (PBL). Emission Database for Global Atmospheric Research (EDGAR): http://edgar.jrc.ec.europa.eu/.
Categories, topics:
Climate Change, Environment
Last updated:
apr 23, 2017
Indicators value changes by year
Meaning:
-29.363
Minimum:
-69.832
jan 1, 1999
Maximum:
-2.952
jan 1, 1995
At the date of observation
Value
Absolute change
Change from the previous value
jan 1, 1992
-13.364
-13.364
0.0%
jan 1, 1993
-28.802
-15.438
115.51%
jan 1, 1994
-29.384
-0.581
2.02%
jan 1, 1995
-2.952
+26.432
-89.95%
jan 1, 1996
-33.553
-30.601
1.04K%
jan 1, 1997
-44.84
-11.287
33.64%
jan 1, 1998
-35.164
+9.676
-21.58%
jan 1, 1999
-69.832
-34.668
98.59%
jan 1, 2000
-63.964
+5.868
-8.4%
jan 1, 2001
-56.522
+7.442
-11.63%
jan 1, 2002
-51.069
+5.453
-9.65%
jan 1, 2003
-44.194
+6.875
-13.46%
jan 1, 2004
-40.273
+3.921
-8.87%
jan 1, 2005
-35.196
+5.076
-12.61%
jan 1, 2006
-29.75
+5.446
-15.47%
jan 1, 2007
-20.572
+9.178
-30.85%
jan 1, 2008
-14.769
+5.803
-28.21%
jan 1, 2009
-8.452
+6.318
-42.78%
jan 1, 2010
-6.733
+1.719
-20.34%
jan 1, 2011
-5.533
+1.2
-17.82%
jan 1, 2012
-5.533
+0.0
0.0%
jan 1, 2013
-5.533
0.0
0.0%
Ranking of countries by current statistics by years