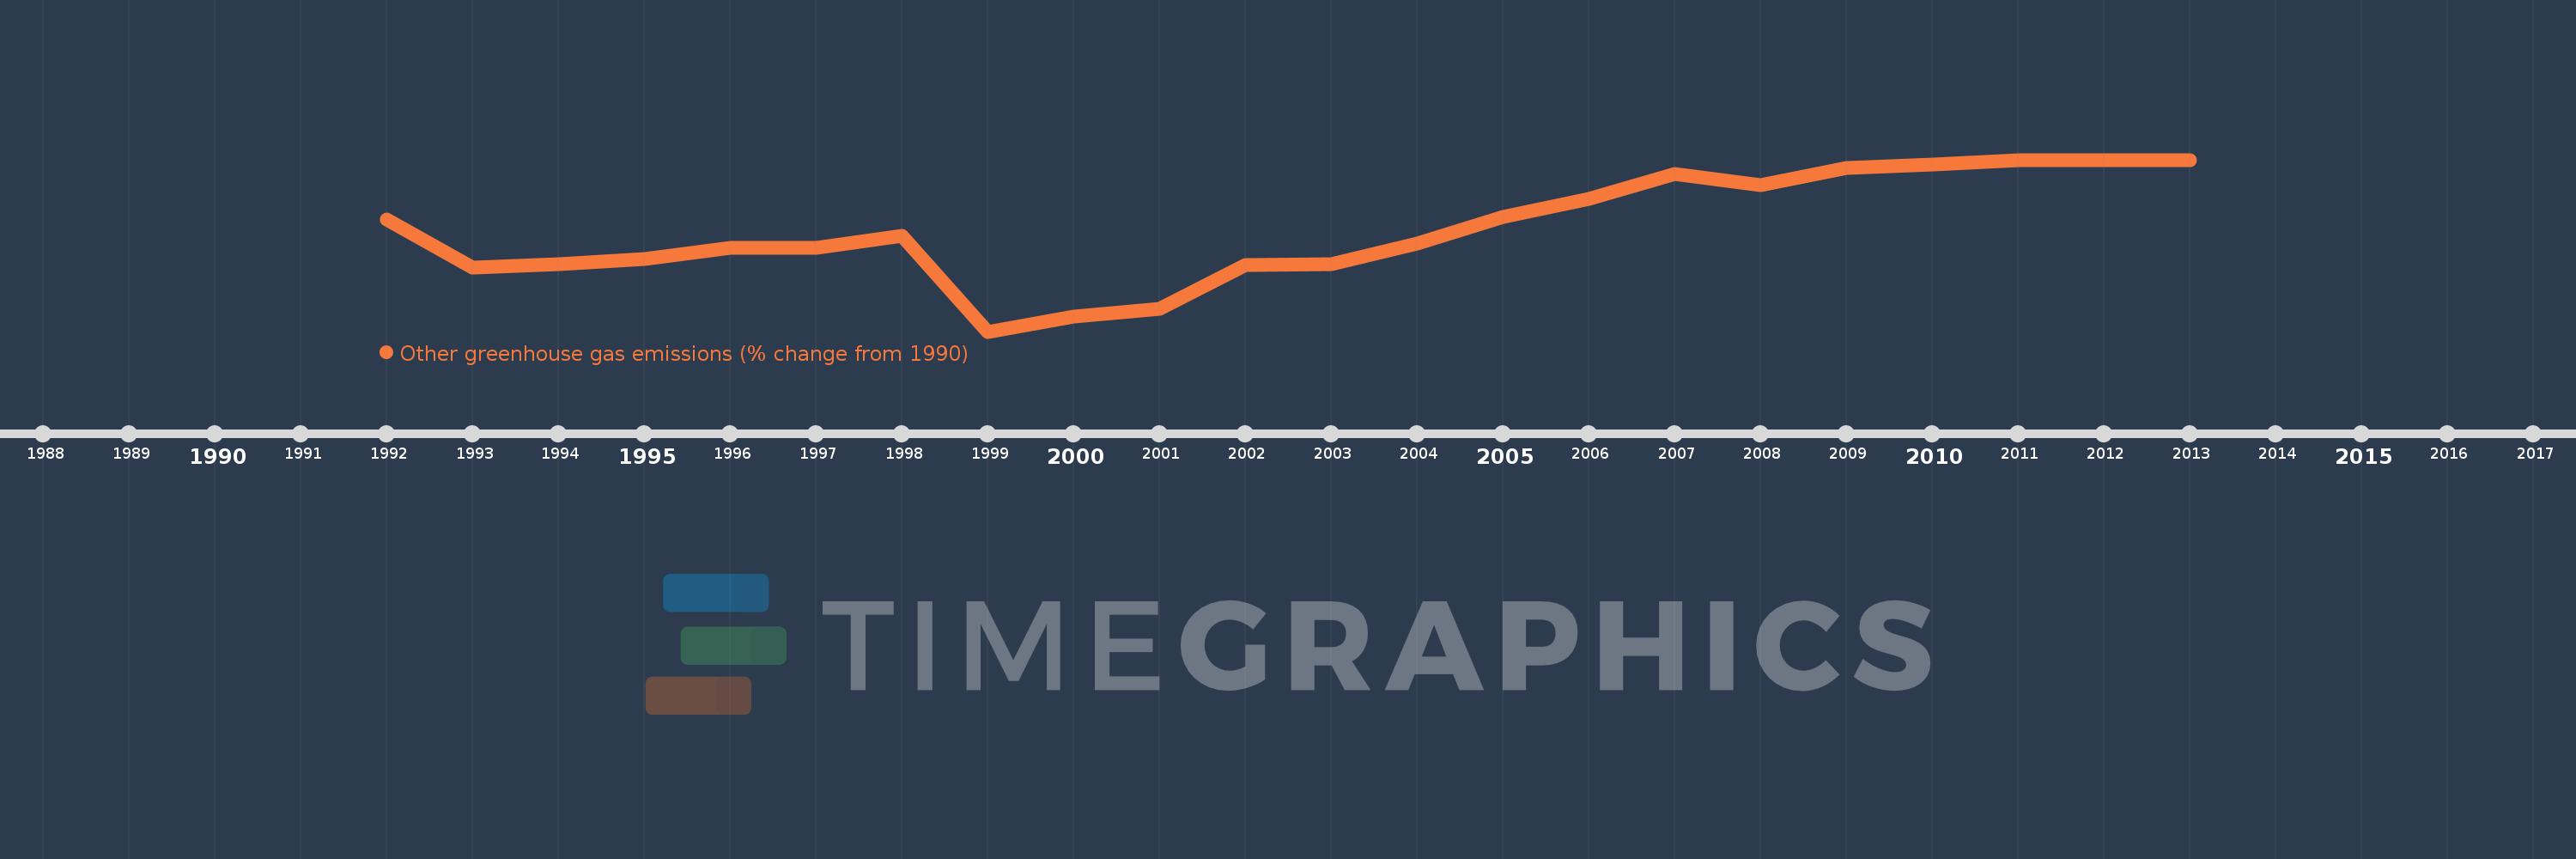
This timeline shows a graph from 1992 to 2013 of Hungary. No data until 1991. Number of actual observations by date: 22.
Source name:
World Development Indicators
Source organization:
World Bank staff estimates from original source: European Commission, Joint Research Centre (JRC)/Netherlands Environmental Assessment Agency (PBL). Emission Database for Global Atmospheric Research (EDGAR): http://edgar.jrc.ec.europa.eu/.
Categories, topics:
Climate Change, Environment
Last updated:
apr 23, 2017
Indicators value changes by year
Meaning:
-12.153
Minimum:
-59.039
jan 1, 1999
Maximum:
20.22
jan 1, 2013
At the date of observation
Value
Absolute change
Change from the previous value
jan 1, 1992
-7.241
-7.241
0.0%
jan 1, 1993
-29.583
-22.341
308.52%
jan 1, 1994
-27.807
+1.775
-6.0%
jan 1, 1995
-25.598
+2.209
-7.94%
jan 1, 1996
-20.381
+5.218
-20.38%
jan 1, 1997
-20.595
-0.214
1.05%
jan 1, 1998
-14.718
+5.877
-28.54%
jan 1, 1999
-59.039
-44.321
301.14%
jan 1, 2000
-52.271
+6.768
-11.46%
jan 1, 2001
-48.632
+3.639
-6.96%
jan 1, 2002
-28.244
+20.387
-41.92%
jan 1, 2003
-28.021
+0.223
-0.79%
jan 1, 2004
-18.511
+9.51
-33.94%
jan 1, 2005
-6.117
+12.394
-66.95%
jan 1, 2006
2.154
+8.271
-135.21%
jan 1, 2007
13.723
+11.569
537.17%
jan 1, 2008
8.491
-5.232
-38.12%
jan 1, 2009
16.425
+7.934
93.44%
jan 1, 2010
17.94
+1.515
9.23%
jan 1, 2011
20.22
+2.279
12.7%
jan 1, 2012
20.22
0.0
0.0%
jan 1, 2013
20.22
+0.0
0.0%
Ranking of countries by current statistics by years