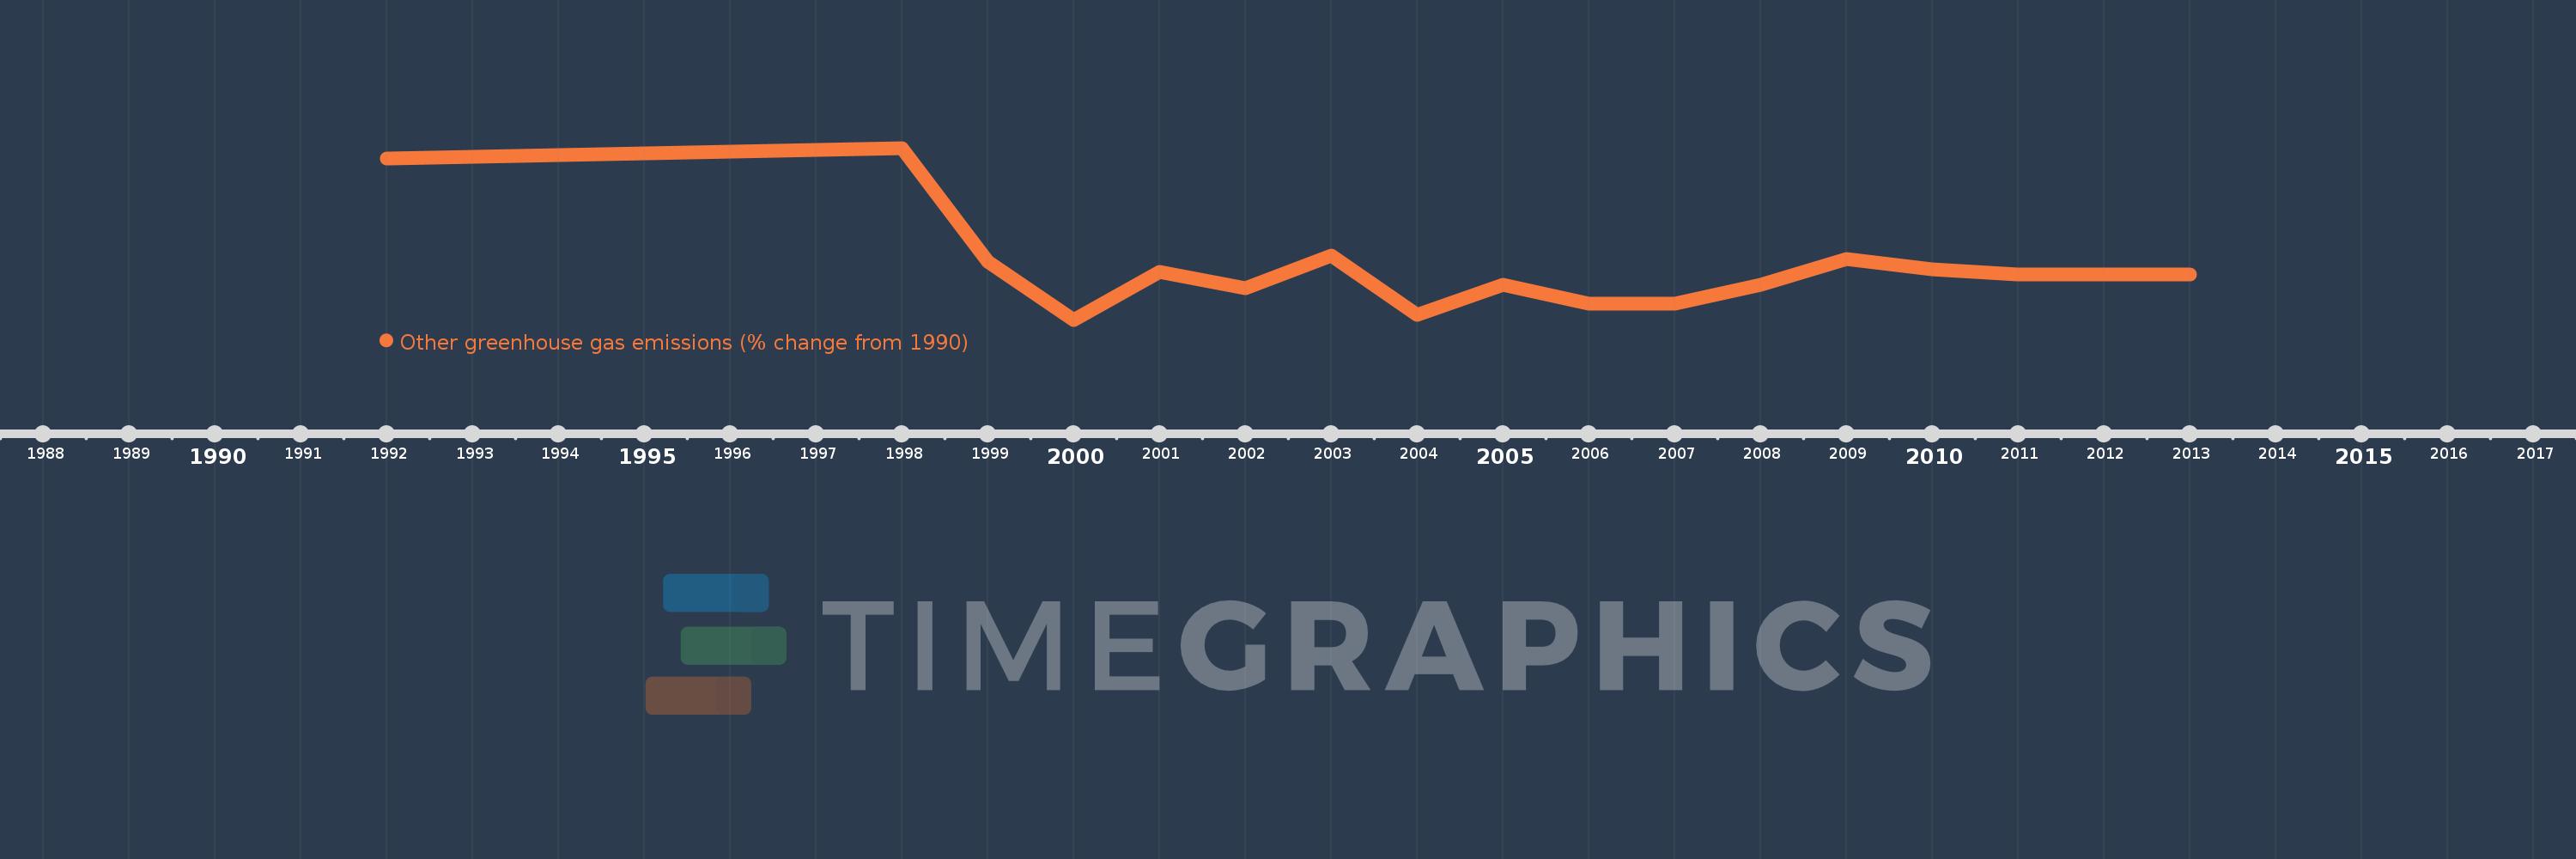
This timeline shows a graph from 1992 to 2013 of Djibouti. No data until 1991. Number of actual observations by date: 22.
Source name:
World Development Indicators
Source organization:
World Bank staff estimates from original source: European Commission, Joint Research Centre (JRC)/Netherlands Environmental Assessment Agency (PBL). Emission Database for Global Atmospheric Research (EDGAR): http://edgar.jrc.ec.europa.eu/.
Categories, topics:
Climate Change, Environment
Last updated:
apr 23, 2017
Indicators value changes by year
Meaning:
-50.934
Minimum:
-100.0
jan 1, 2000
Maximum:
7.778
jan 1, 1998
At the date of observation
Value
Absolute change
Change from the previous value
jan 1, 1992
1.111
+1.111
0.0%
jan 1, 1993
2.222
+1.111
99.94%
jan 1, 1994
3.333
+1.111
50.02%
jan 1, 1995
4.445
+1.111
33.34%
jan 1, 1996
5.555
+1.111
24.99%
jan 1, 1997
6.667
+1.111
20.0%
jan 1, 1998
7.778
+1.111
16.67%
jan 1, 1999
-63.333
-71.111
-914.26%
jan 1, 2000
-100.0
-36.667
57.89%
jan 1, 2001
-70.0
+30.0
-30.0%
jan 1, 2002
-80.0
-10.0
14.29%
jan 1, 2003
-60.0
+20.0
-25.0%
jan 1, 2004
-96.667
-36.667
61.11%
jan 1, 2005
-78.333
+18.333
-18.97%
jan 1, 2006
-90.0
-11.667
14.89%
jan 1, 2007
-90.0
0.0
0.0%
jan 1, 2008
-78.333
+11.667
-12.96%
jan 1, 2009
-61.667
+16.667
-21.28%
jan 1, 2010
-68.333
-6.667
10.81%
jan 1, 2011
-71.667
-3.333
4.88%
jan 1, 2012
-71.667
0.0
0.0%
jan 1, 2013
-71.667
+0.0
0.0%
Ranking of countries by current statistics by years