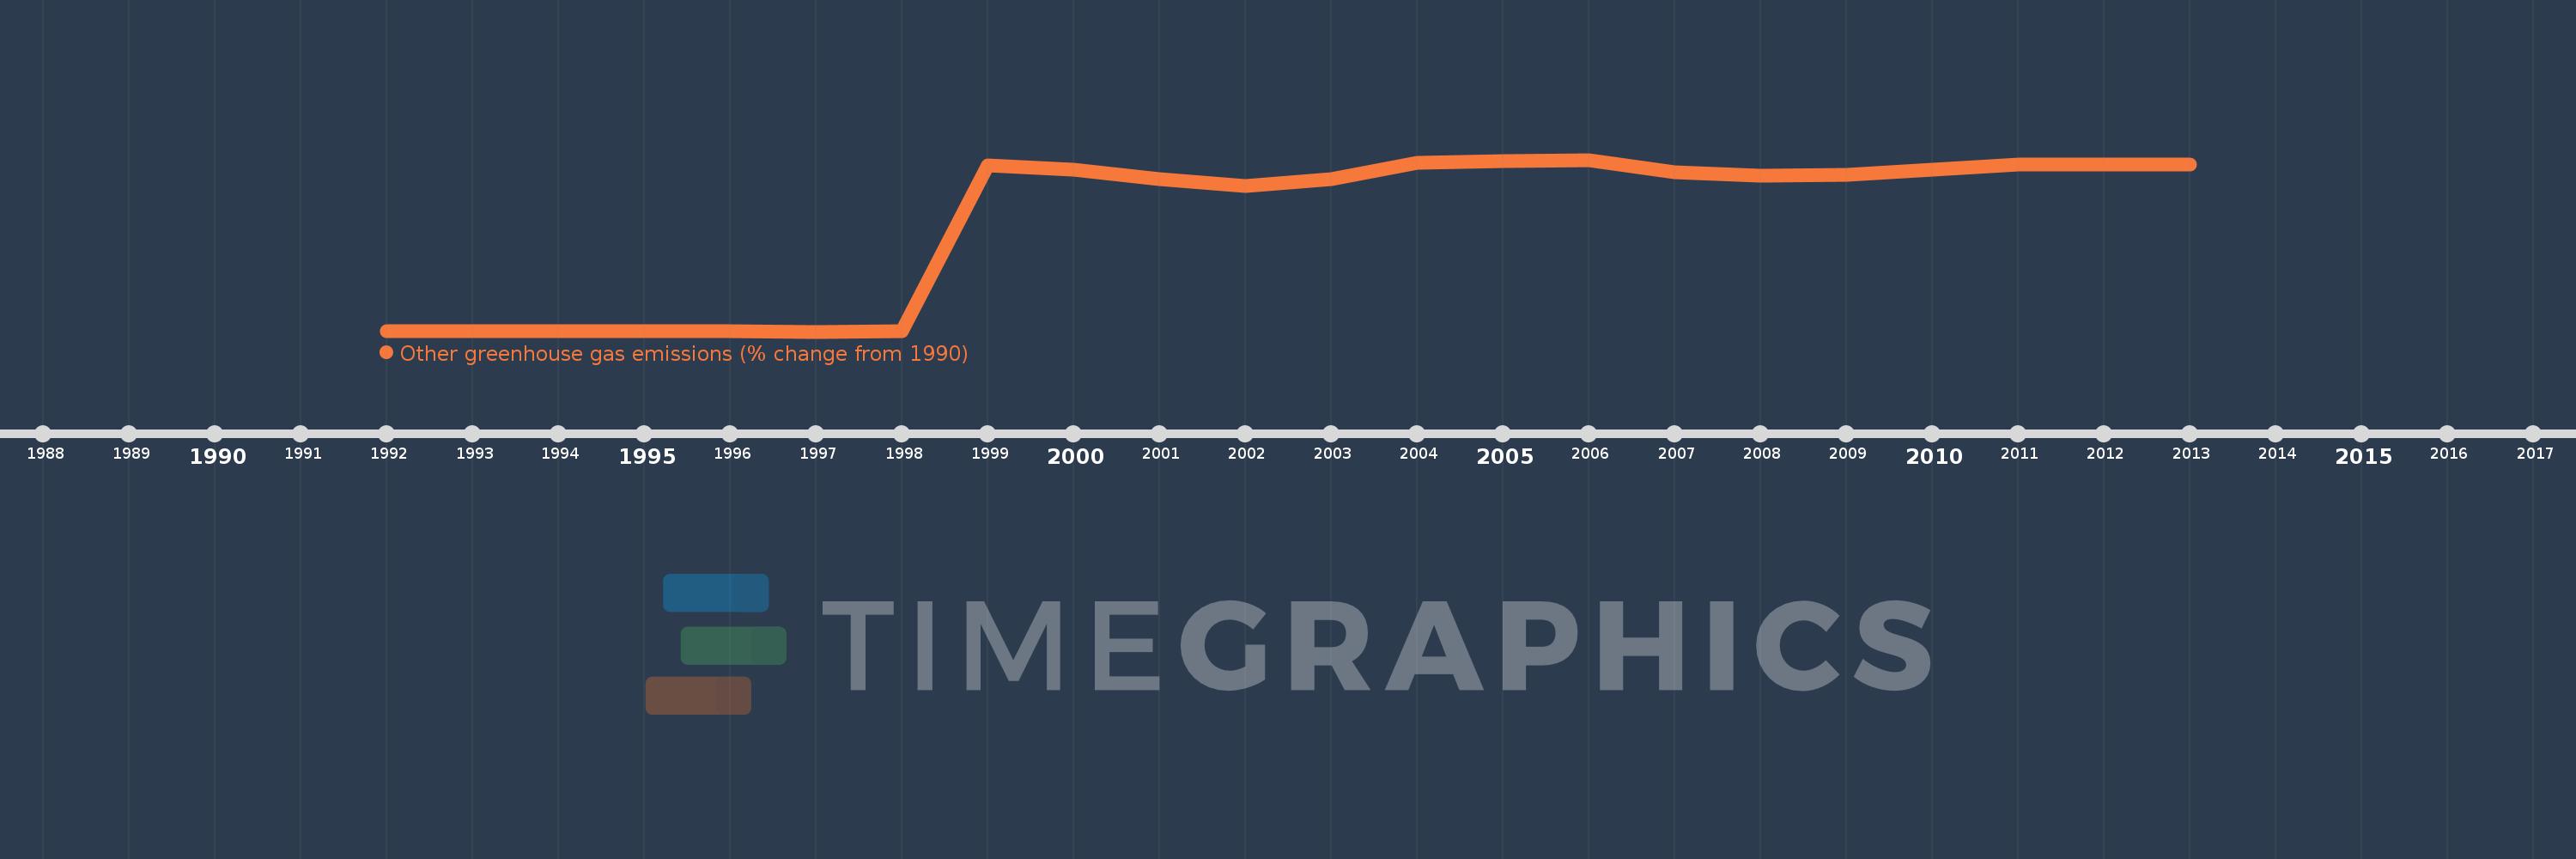
This timeline shows a graph from 1992 to 2013 of Angola. No data until 1991. Number of actual observations by date: 22.
Source name:
World Development Indicators
Source organization:
World Bank staff estimates from original source: European Commission, Joint Research Centre (JRC)/Netherlands Environmental Assessment Agency (PBL). Emission Database for Global Atmospheric Research (EDGAR): http://edgar.jrc.ec.europa.eu/.
Categories, topics:
Climate Change, Environment
Last updated:
apr 23, 2017
Indicators value changes by year
Meaning:
4.826K
Minimum:
-10.615
jan 1, 1997
Maximum:
7.53K
jan 1, 2006
At the date of observation
Value
Absolute change
Change from the previous value
jan 1, 1992
-2.159
-2.159
0.0%
jan 1, 1993
-2.72
-0.561
25.97%
jan 1, 1994
-5.166
-2.447
89.96%
jan 1, 1995
-9.05
-3.884
75.19%
jan 1, 1996
-10.103
-1.052
11.63%
jan 1, 1997
-10.615
-0.513
5.07%
jan 1, 1998
-5.881
+4.735
-44.6%
jan 1, 1999
7.286K
+7.292K
-123.99K%
jan 1, 2000
7.102K
-184.016
-2.53%
jan 1, 2001
6.691K
-410.66
-5.78%
jan 1, 2002
6.365K
-326.405
-4.88%
jan 1, 2003
6.689K
+324.577
5.1%
jan 1, 2004
7.392K
+702.616
10.5%
jan 1, 2005
7.461K
+69.306
0.94%
jan 1, 2006
7.53K
+68.71
0.92%
jan 1, 2007
6.966K
-563.761
-7.49%
jan 1, 2008
6.847K
-119.125
-1.71%
jan 1, 2009
6.859K
+11.917
0.17%
jan 1, 2010
7.111K
+251.859
3.67%
jan 1, 2011
7.308K
+197.49
2.78%
jan 1, 2012
7.308K
0.0
0.0%
jan 1, 2013
7.308K
0.0
0.0%
Ranking of countries by current statistics by years