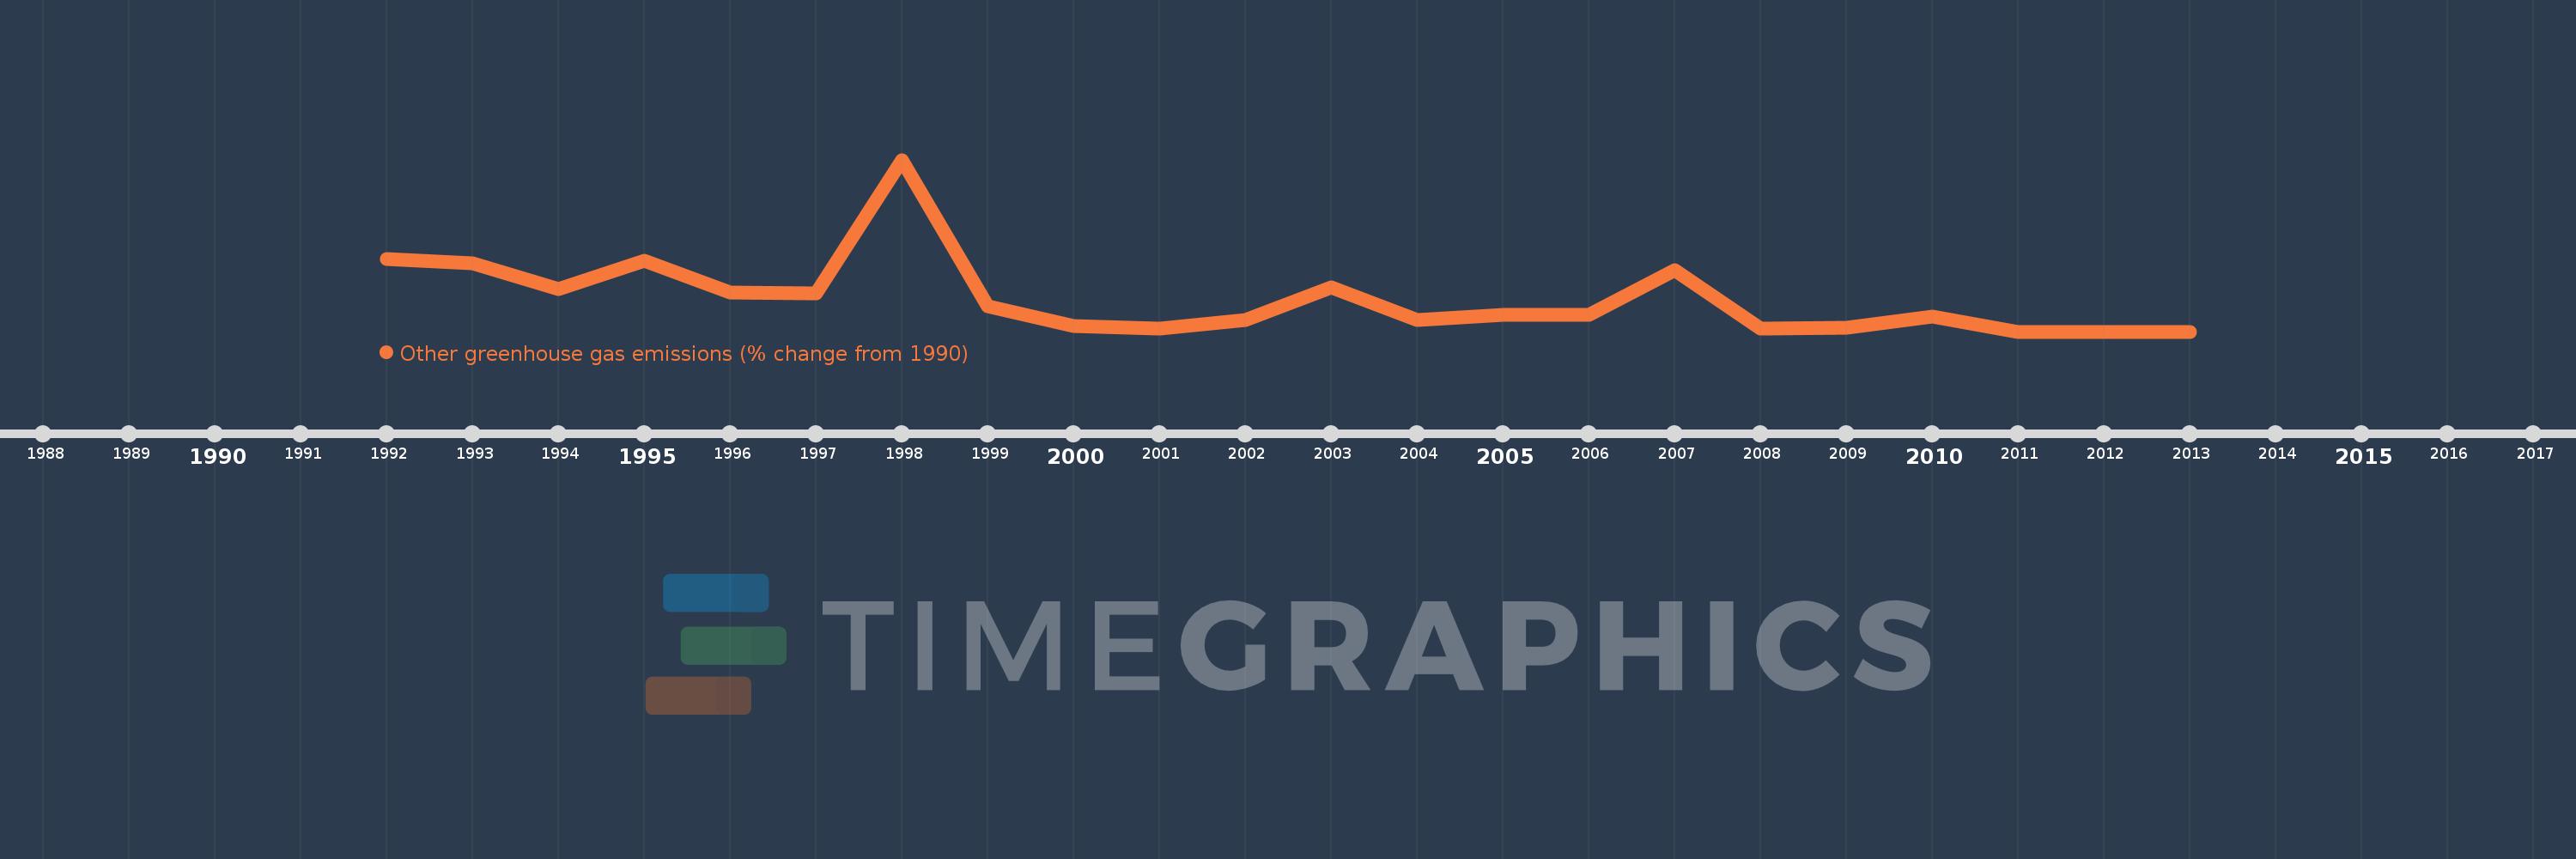
This timeline shows a graph from 1992 to 2013 of Indonesia. No data until 1991. Number of actual observations by date: 22.
Source name:
World Development Indicators
Source organization:
World Bank staff estimates from original source: European Commission, Joint Research Centre (JRC)/Netherlands Environmental Assessment Agency (PBL). Emission Database for Global Atmospheric Research (EDGAR): http://edgar.jrc.ec.europa.eu/.
Categories, topics:
Climate Change, Environment
Last updated:
apr 23, 2017
Indicators value changes by year
Meaning:
-3.821
Minimum:
-99.632
jan 1, 2012
Maximum:
403.316
jan 1, 1998
At the date of observation
Value
Absolute change
Change from the previous value
jan 1, 1992
112.923
+112.923
0.0%
jan 1, 1993
100.795
-12.128
-10.74%
jan 1, 1994
24.359
-76.436
-75.83%
jan 1, 1995
106.683
+82.324
337.96%
jan 1, 1996
15.359
-91.323
-85.6%
jan 1, 1997
13.123
-2.236
-14.56%
jan 1, 1998
403.316
+390.193
2.97K%
jan 1, 1999
-25.917
-429.234
-106.43%
jan 1, 2000
-84.278
-58.36
225.18%
jan 1, 2001
-90.923
-6.646
7.89%
jan 1, 2002
-66.227
+24.696
-27.16%
jan 1, 2003
30.219
+96.446
-145.63%
jan 1, 2004
-65.826
-96.045
-317.83%
jan 1, 2005
-51.042
+14.784
-22.46%
jan 1, 2006
-50.861
+0.181
-0.36%
jan 1, 2007
79.519
+130.379
-256.35%
jan 1, 2008
-91.217
-170.736
-214.71%
jan 1, 2009
-89.015
+2.201
-2.41%
jan 1, 2010
-56.147
+32.868
-36.92%
jan 1, 2011
-99.632
-43.485
77.45%
jan 1, 2012
-99.632
0.0
0.0%
jan 1, 2013
-99.632
0.0
0.0%
Ranking of countries by current statistics by years