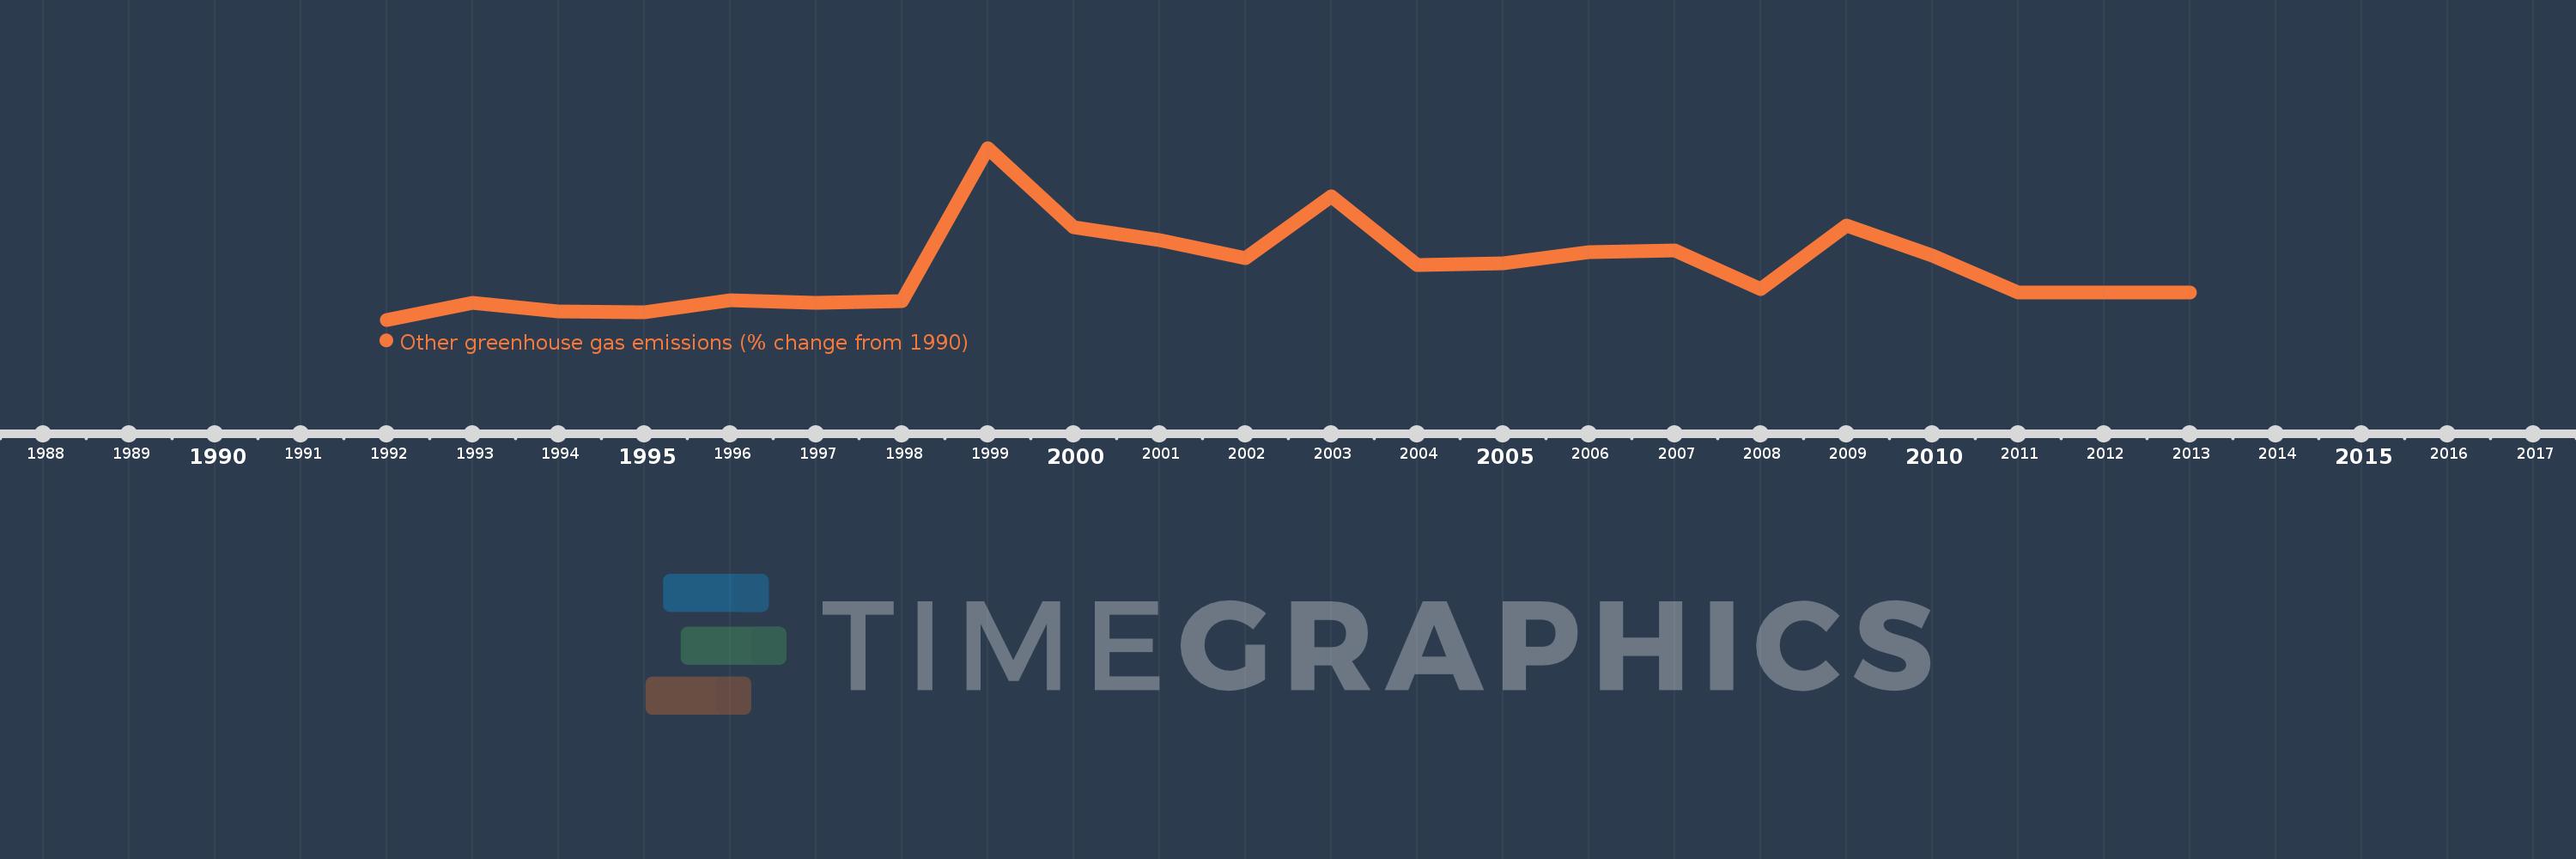
This timeline shows a graph from 1992 to 2013 of Guinea. No data until 1991. Number of actual observations by date: 22.
Source name:
World Development Indicators
Source organization:
World Bank staff estimates from original source: European Commission, Joint Research Centre (JRC)/Netherlands Environmental Assessment Agency (PBL). Emission Database for Global Atmospheric Research (EDGAR): http://edgar.jrc.ec.europa.eu/.
Categories, topics:
Climate Change, Environment
Last updated:
apr 23, 2017
Indicators value changes by year
Meaning:
18.869
Minimum:
-18.397
jan 1, 1992
Maximum:
105.559
jan 1, 1999
At the date of observation
Value
Absolute change
Change from the previous value
jan 1, 1992
-18.397
-18.397
0.0%
jan 1, 1993
-6.436
+11.961
-65.02%
jan 1, 1994
-12.45
-6.014
93.45%
jan 1, 1995
-12.804
-0.354
2.84%
jan 1, 1996
-4.027
+8.777
-68.55%
jan 1, 1997
-6.361
-2.334
57.95%
jan 1, 1998
-4.667
+1.694
-26.64%
jan 1, 1999
105.559
+110.226
-2.36K%
jan 1, 2000
48.56
-57.0
-54.0%
jan 1, 2001
39.24
-9.32
-19.19%
jan 1, 2002
26.104
-13.136
-33.48%
jan 1, 2003
70.702
+44.598
170.85%
jan 1, 2004
20.819
-49.883
-70.55%
jan 1, 2005
22.333
+1.514
7.27%
jan 1, 2006
30.445
+8.112
36.32%
jan 1, 2007
31.9
+1.455
4.78%
jan 1, 2008
3.931
-27.97
-87.68%
jan 1, 2009
49.877
+45.946
1.17K%
jan 1, 2010
27.673
-22.204
-44.52%
jan 1, 2011
1.038
-26.635
-96.25%
jan 1, 2012
1.038
+0.0
0.0%
jan 1, 2013
1.038
0.0
0.0%
Ranking of countries by current statistics by years