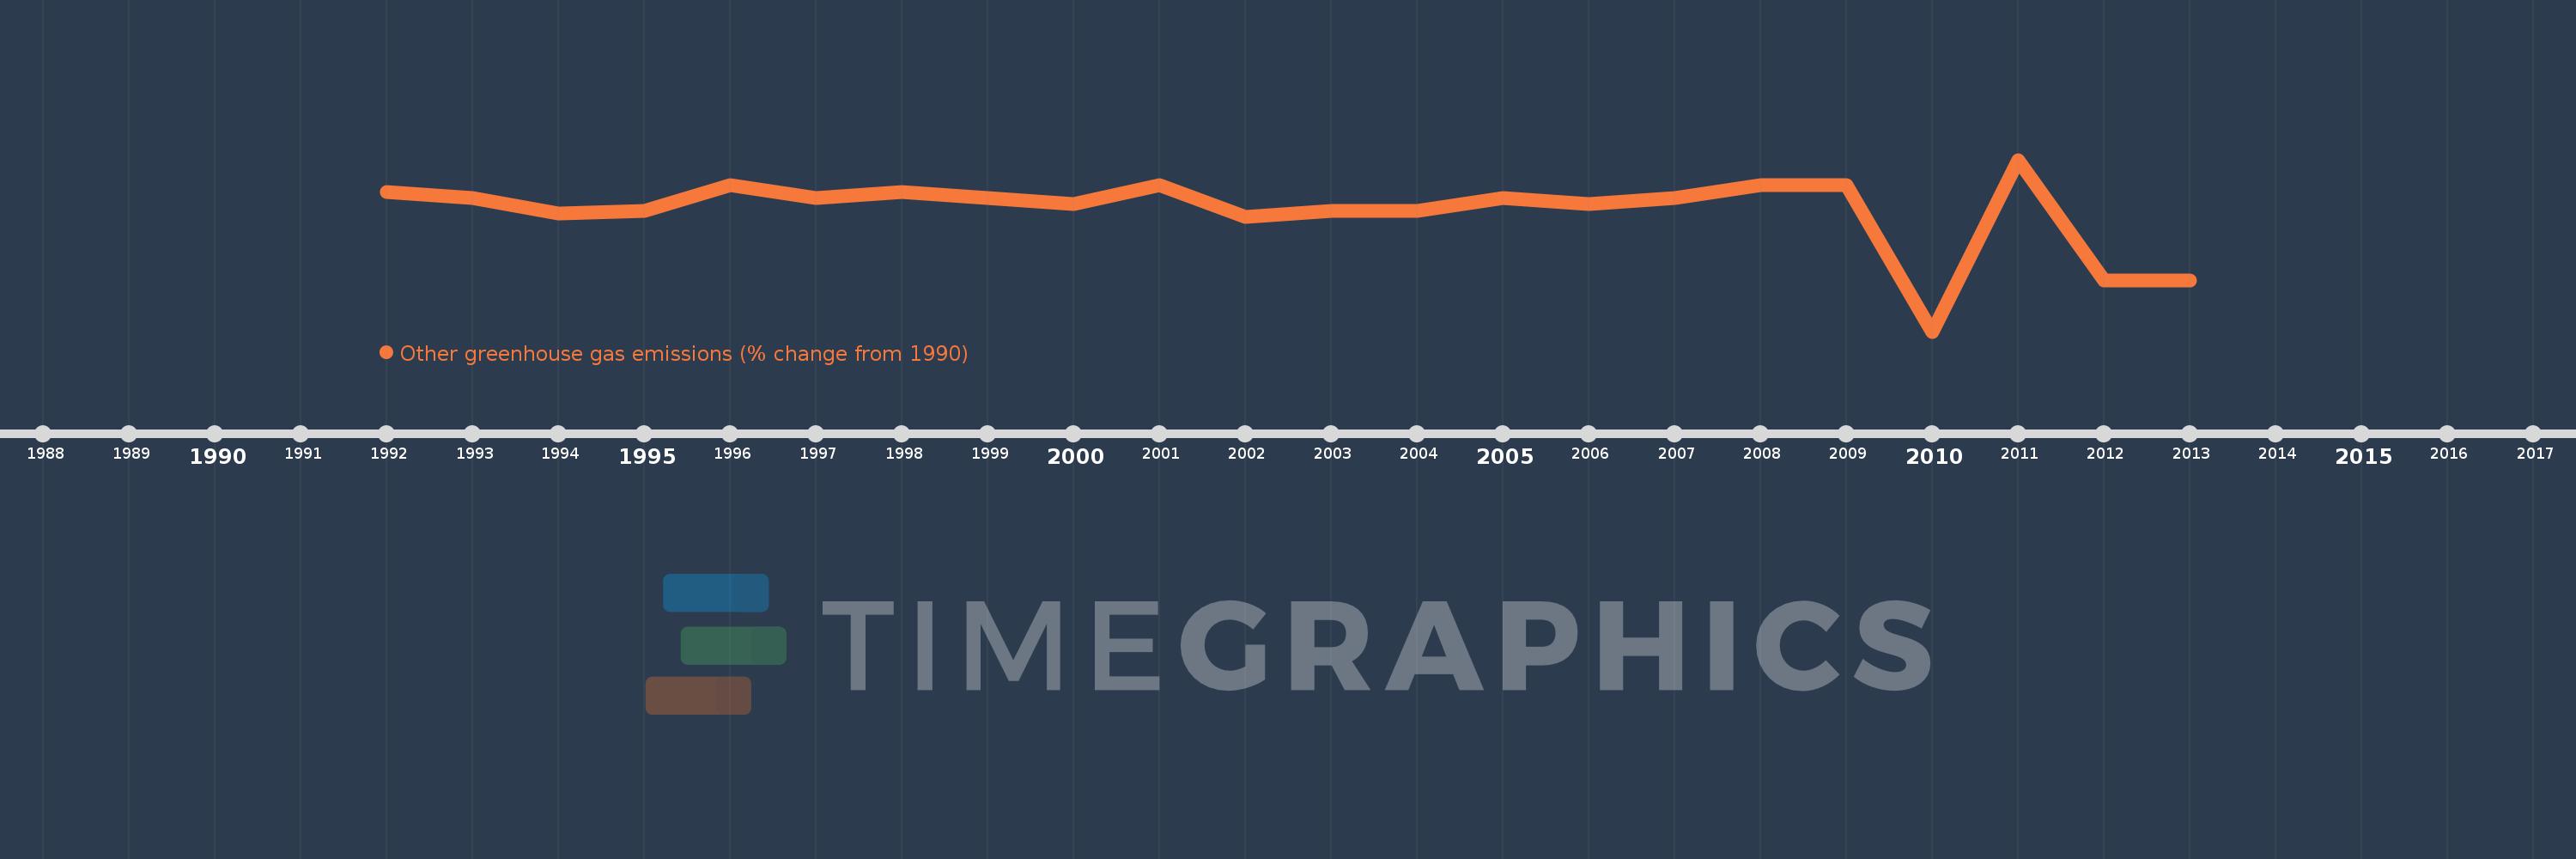
This timeline shows a graph from 1992 to 2013 of Tuvalu. No data until 1991. Number of actual observations by date: 22.
Source name:
World Development Indicators
Source organization:
World Bank staff estimates from original source: European Commission, Joint Research Centre (JRC)/Netherlands Environmental Assessment Agency (PBL). Emission Database for Global Atmospheric Research (EDGAR): http://edgar.jrc.ec.europa.eu/.
Categories, topics:
Climate Change, Environment
Last updated:
apr 23, 2017
Indicators value changes by year
Meaning:
-180.909
Minimum:
-940.0
jan 1, 2010
Maximum:
140.0
jan 1, 2011
At the date of observation
Value
Absolute change
Change from the previous value
jan 1, 1992
-60.0
-60.0
0.0%
jan 1, 1993
-100.0
-40.0
66.67%
jan 1, 1994
-200.0
-100.0
100.0%
jan 1, 1995
-180.0
+20.0
-10.0%
jan 1, 1996
-20.0
+160.0
-88.89%
jan 1, 1997
-100.0
-80.0
400.0%
jan 1, 1998
-60.0
+40.0
-40.0%
jan 1, 1999
-100.0
-40.0
66.67%
jan 1, 2000
-140.0
-40.0
40.0%
jan 1, 2001
-20.0
+120.0
-85.71%
jan 1, 2002
-220.0
-200.0
1000.0%
jan 1, 2003
-180.0
+40.0
-18.18%
jan 1, 2004
-180.0
0.0
0.0%
jan 1, 2005
-100.0
+80.0
-44.44%
jan 1, 2006
-140.0
-40.0
40.0%
jan 1, 2007
-100.0
+40.0
-28.57%
jan 1, 2008
-20.0
+80.0
-80.0%
jan 1, 2009
-20.0
0.0
0.0%
jan 1, 2010
-940.0
-920.0
4.6K%
jan 1, 2011
140.0
+1.08K
-114.89%
jan 1, 2012
-620.0
-760.0
-542.86%
jan 1, 2013
-620.0
0.0
0.0%
Ranking of countries by current statistics by years