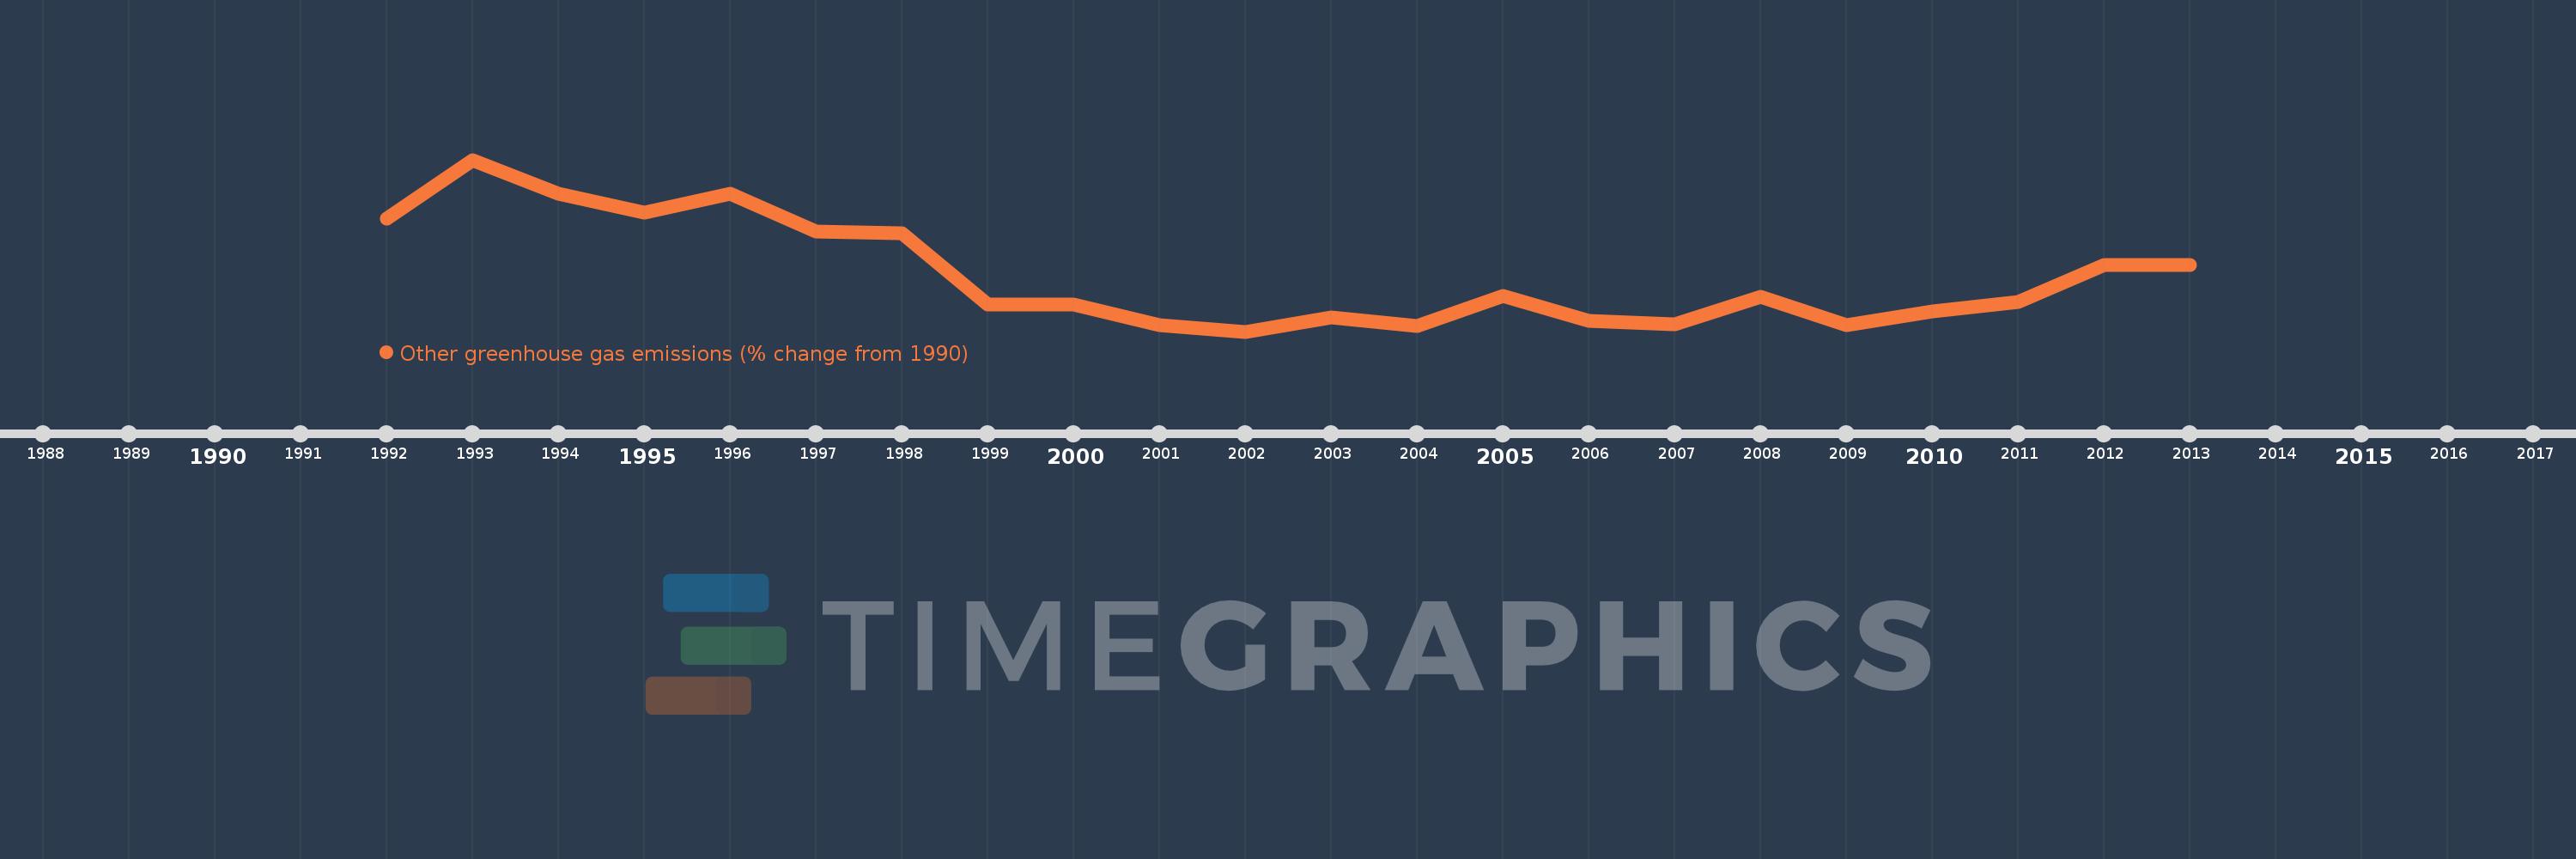
This timeline shows a graph from 1992 to 2013 of Myanmar. No data until 1991. Number of actual observations by date: 22.
Source name:
World Development Indicators
Source organization:
World Bank staff estimates from original source: European Commission, Joint Research Centre (JRC)/Netherlands Environmental Assessment Agency (PBL). Emission Database for Global Atmospheric Research (EDGAR): http://edgar.jrc.ec.europa.eu/.
Categories, topics:
Climate Change, Environment
Last updated:
apr 23, 2017
Indicators value changes by year
Meaning:
-52.856
Minimum:
-94.275
jan 1, 2002
Maximum:
32.53
jan 1, 1993
At the date of observation
Value
Absolute change
Change from the previous value
jan 1, 1992
-11.152
-11.152
0.0%
jan 1, 1993
32.53
+43.682
-391.7%
jan 1, 1994
7.438
-25.093
-77.14%
jan 1, 1995
-6.503
-13.941
-187.43%
jan 1, 1996
7.438
+13.941
-214.37%
jan 1, 1997
-20.444
-27.882
-374.87%
jan 1, 1998
-21.373
-0.929
4.55%
jan 1, 1999
-74.454
-53.081
248.35%
jan 1, 2000
-74.458
-0.003
0.0%
jan 1, 2001
-89.476
-15.018
20.17%
jan 1, 2002
-94.275
-4.8
5.36%
jan 1, 2003
-84.02
+10.255
-10.88%
jan 1, 2004
-90.004
-5.983
7.12%
jan 1, 2005
-67.935
+22.069
-24.52%
jan 1, 2006
-86.58
-18.645
27.45%
jan 1, 2007
-88.669
-2.089
2.41%
jan 1, 2008
-68.694
+19.975
-22.53%
jan 1, 2009
-89.802
-21.108
30.73%
jan 1, 2010
-79.555
+10.247
-11.41%
jan 1, 2011
-72.23
+7.325
-9.21%
jan 1, 2012
-45.306
+26.925
-37.28%
jan 1, 2013
-45.306
0.0
0.0%
Ranking of countries by current statistics by years