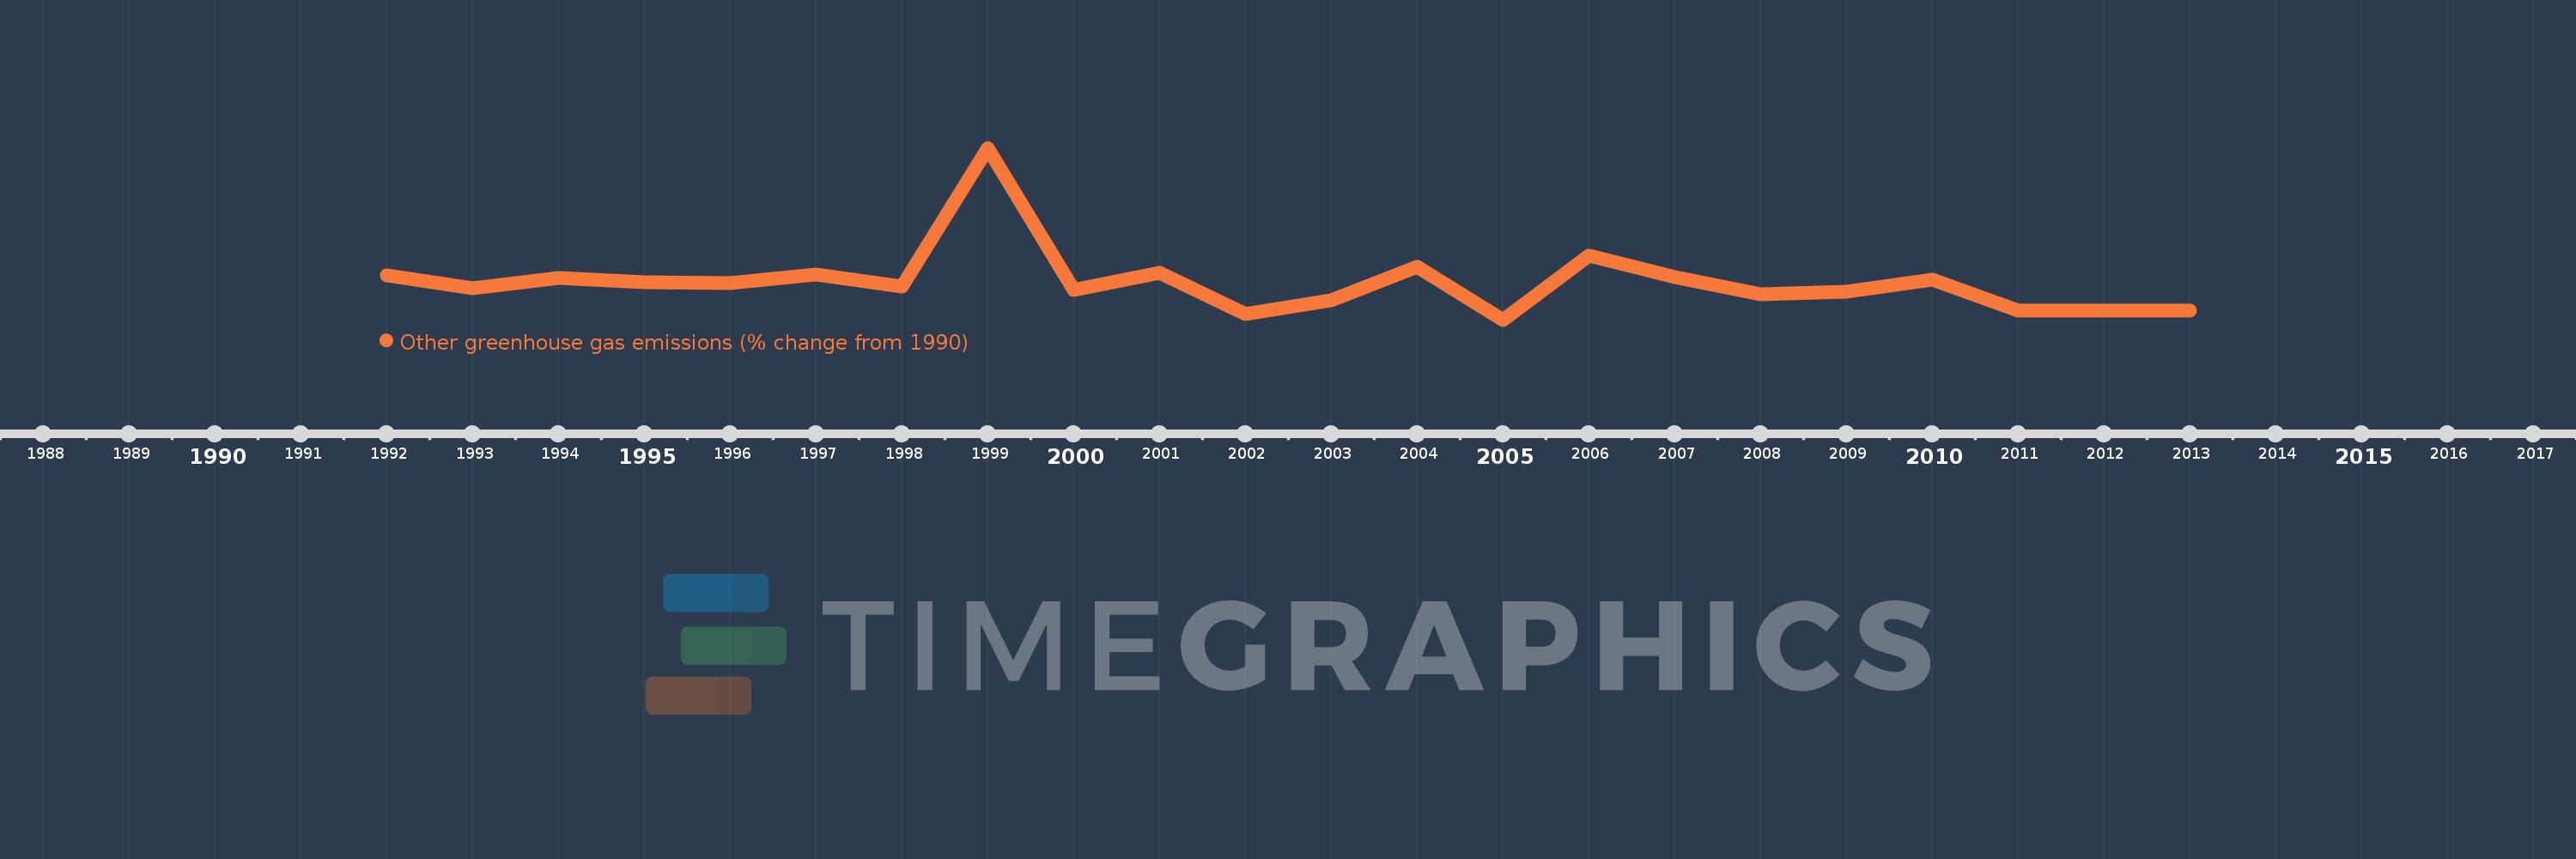
This timeline shows a graph from 1992 to 2013 of Mexico. No data until 1991. Number of actual observations by date: 22.
Source name:
World Development Indicators
Source organization:
World Bank staff estimates from original source: European Commission, Joint Research Centre (JRC)/Netherlands Environmental Assessment Agency (PBL). Emission Database for Global Atmospheric Research (EDGAR): http://edgar.jrc.ec.europa.eu/.
Categories, topics:
Climate Change, Environment
Last updated:
apr 23, 2017
Indicators value changes by year
Meaning:
12.836
Minimum:
-55.098
jan 1, 2005
Maximum:
256.372
jan 1, 1999
At the date of observation
Value
Absolute change
Change from the previous value
jan 1, 1992
25.639
+25.639
0.0%
jan 1, 1993
1.309
-24.33
-94.89%
jan 1, 1994
20.108
+18.799
1.44K%
jan 1, 1995
12.608
-7.5
-37.3%
jan 1, 1996
11.932
-0.676
-5.36%
jan 1, 1997
26.719
+14.787
123.92%
jan 1, 1998
4.473
-22.246
-83.26%
jan 1, 1999
256.372
+251.899
5.63K%
jan 1, 2000
-0.374
-256.746
-100.15%
jan 1, 2001
29.484
+29.858
-7.98K%
jan 1, 2002
-44.32
-73.804
-250.32%
jan 1, 2003
-20.37
+23.95
-54.04%
jan 1, 2004
41.16
+61.531
-302.06%
jan 1, 2005
-55.098
-96.258
-233.86%
jan 1, 2006
60.888
+115.986
-210.51%
jan 1, 2007
21.732
-39.156
-64.31%
jan 1, 2008
-8.095
-29.827
-137.25%
jan 1, 2009
-3.925
+4.17
-51.51%
jan 1, 2010
17.845
+21.77
-554.59%
jan 1, 2011
-38.565
-56.409
-316.11%
jan 1, 2012
-38.565
0.0
0.0%
jan 1, 2013
-38.565
0.0
0.0%
Ranking of countries by current statistics by years