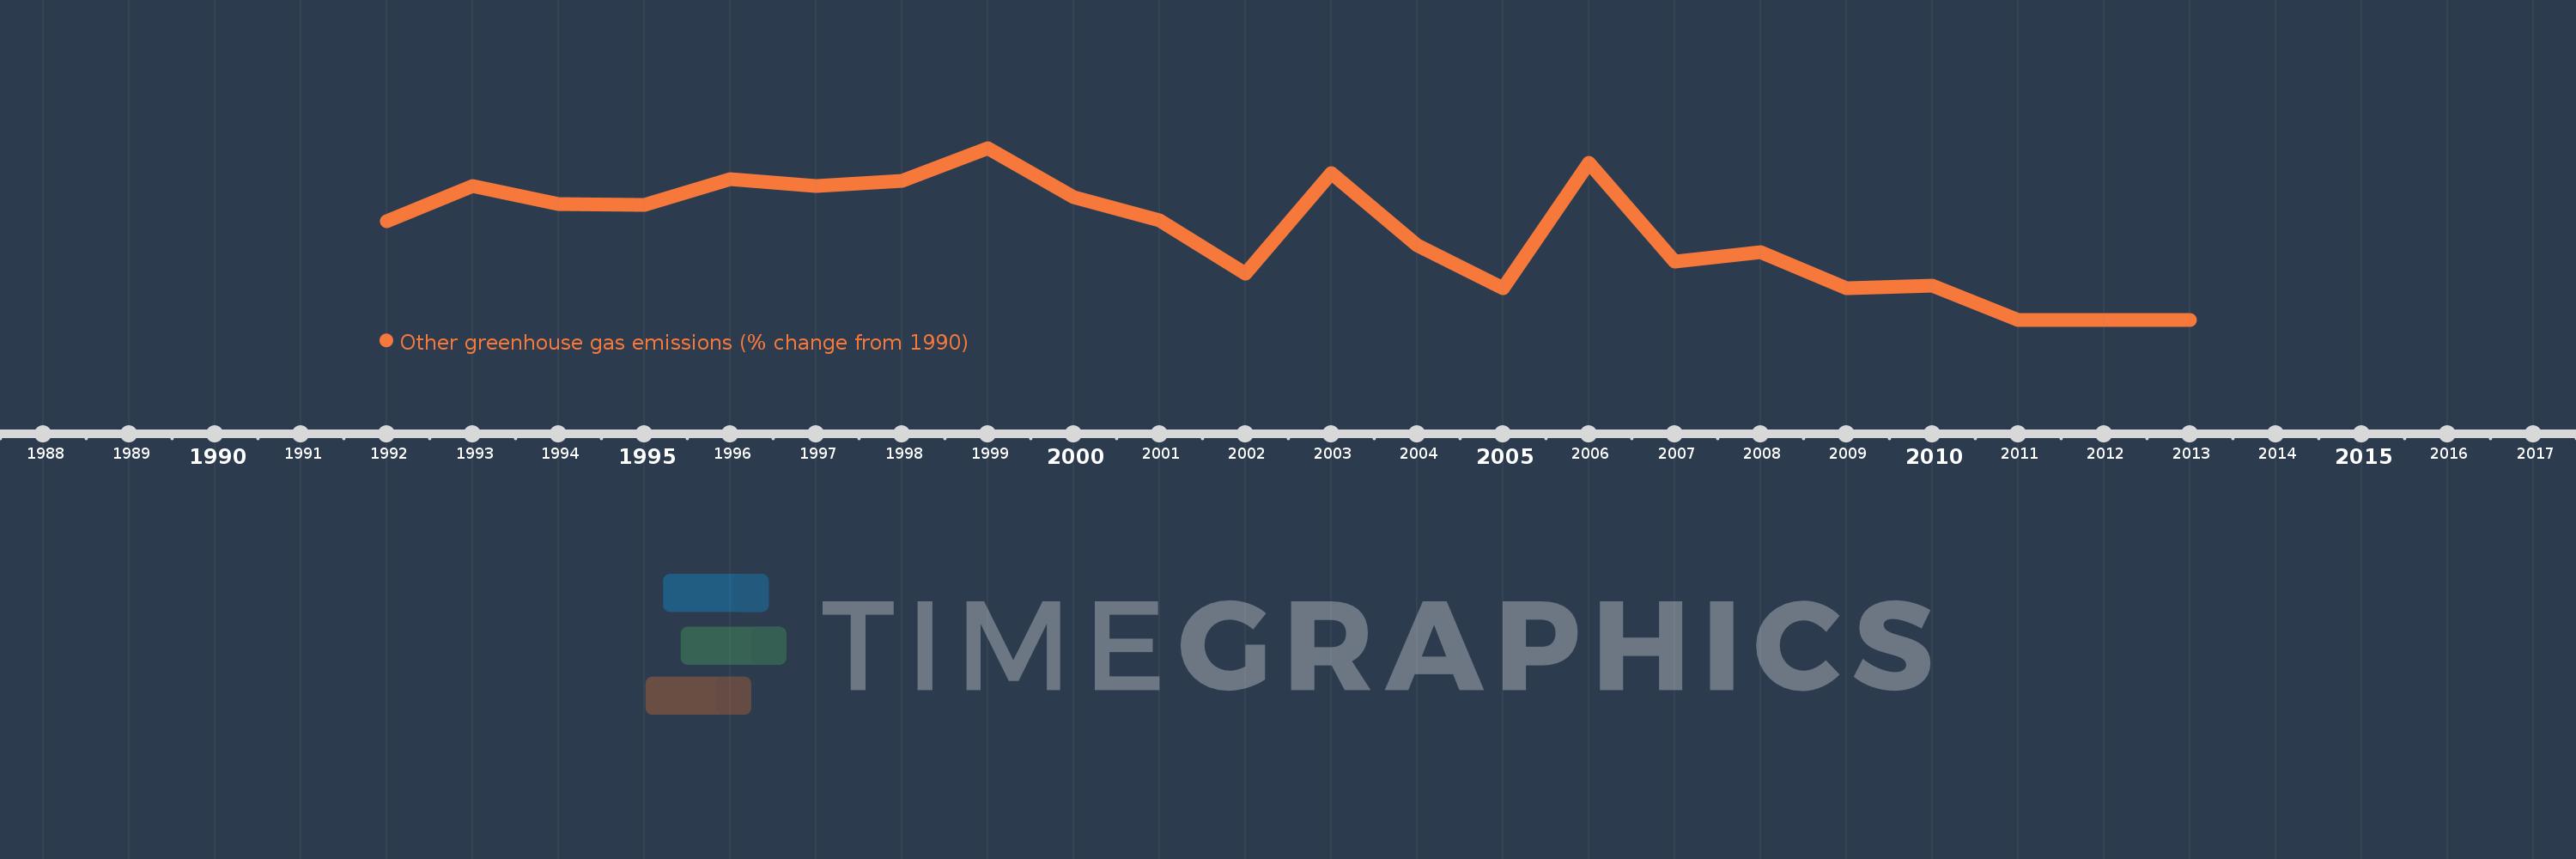
This timeline shows a graph from 1992 to 2013 of Benin. No data until 1991. Number of actual observations by date: 22.
Source name:
World Development Indicators
Source organization:
World Bank staff estimates from original source: European Commission, Joint Research Centre (JRC)/Netherlands Environmental Assessment Agency (PBL). Emission Database for Global Atmospheric Research (EDGAR): http://edgar.jrc.ec.europa.eu/.
Categories, topics:
Climate Change, Environment
Last updated:
apr 23, 2017
Indicators value changes by year
Meaning:
-23.118
Minimum:
-53.97
jan 1, 2011
Maximum:
6.846
jan 1, 1999
At the date of observation
Value
Absolute change
Change from the previous value
jan 1, 1992
-19.068
-19.068
0.0%
jan 1, 1993
-6.672
+12.396
-65.01%
jan 1, 1994
-12.909
-6.237
93.47%
jan 1, 1995
-13.273
-0.364
2.82%
jan 1, 1996
-4.18
+9.093
-68.51%
jan 1, 1997
-6.602
-2.422
57.94%
jan 1, 1998
-4.836
+1.765
-26.74%
jan 1, 1999
6.846
+11.682
-241.55%
jan 1, 2000
-10.631
-17.477
-255.28%
jan 1, 2001
-18.677
-8.047
75.69%
jan 1, 2002
-37.635
-18.957
101.5%
jan 1, 2003
-2.075
+35.559
-94.49%
jan 1, 2004
-27.491
-25.416
1.22K%
jan 1, 2005
-42.962
-15.471
56.28%
jan 1, 2006
1.728
+44.69
-104.02%
jan 1, 2007
-33.507
-35.235
-2.04K%
jan 1, 2008
-29.947
+3.56
-10.63%
jan 1, 2009
-42.804
-12.857
42.93%
jan 1, 2010
-41.989
+0.815
-1.9%
jan 1, 2011
-53.97
-11.981
28.53%
jan 1, 2012
-53.97
0.0
0.0%
jan 1, 2013
-53.97
0.0
0.0%
Ranking of countries by current statistics by years