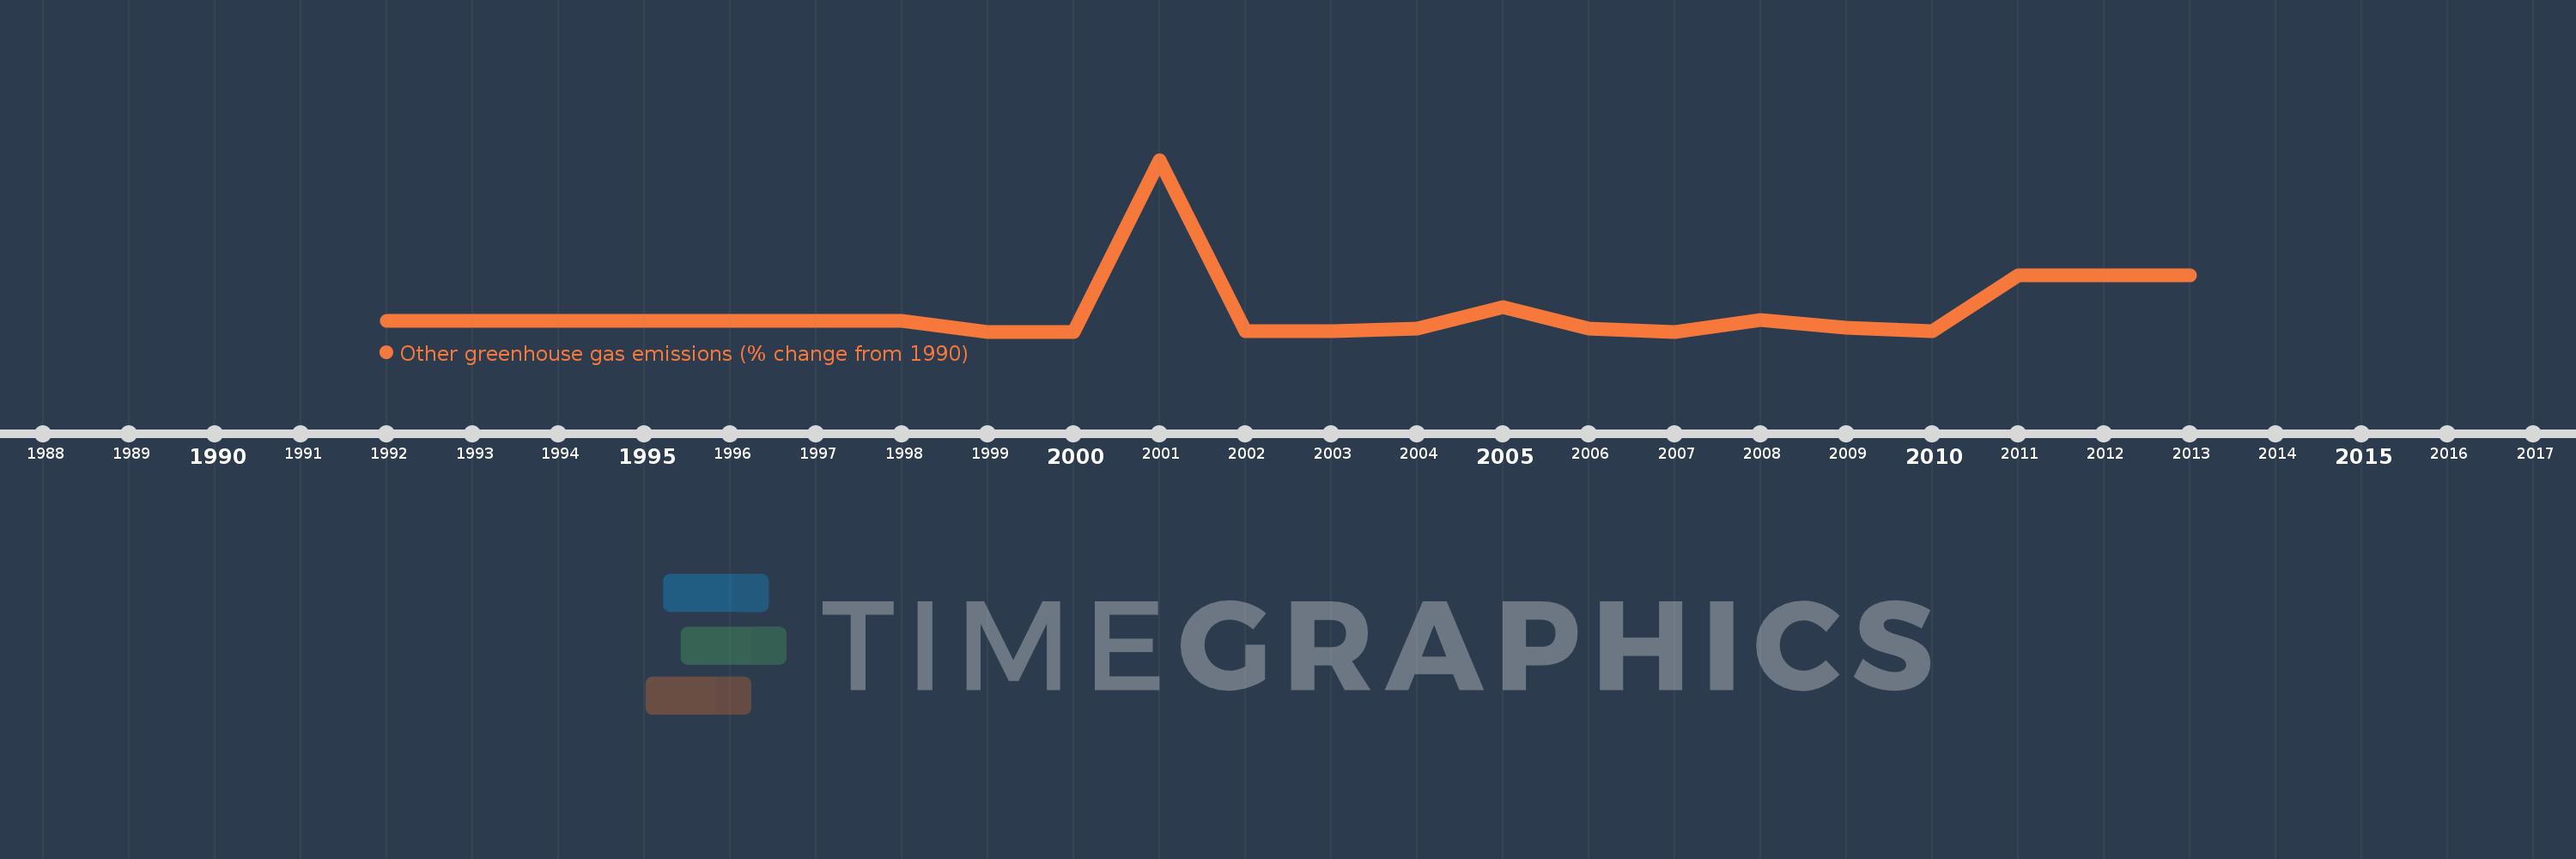
This timeline shows a graph from 1992 to 2013 of Tunisia. No data until 1991. Number of actual observations by date: 22.
Source name:
World Development Indicators
Source organization:
World Bank staff estimates from original source: European Commission, Joint Research Centre (JRC)/Netherlands Environmental Assessment Agency (PBL). Emission Database for Global Atmospheric Research (EDGAR): http://edgar.jrc.ec.europa.eu/.
Categories, topics:
Climate Change, Environment
Last updated:
apr 23, 2017
Indicators value changes by year
Meaning:
98.639
Minimum:
-100.0
jan 1, 2000
Maximum:
1.529K
jan 1, 2001
At the date of observation
Value
Absolute change
Change from the previous value
jan 1, 1992
0.0
+0.0
0.0%
jan 1, 1993
0.0
0.0
-49.44%
jan 1, 1994
0.0
0.0
-100.0%
jan 1, 1995
0.0
0.0
%
jan 1, 1996
0.0
+0.0
%
jan 1, 1997
0.0
+0.0
493.41%
jan 1, 1998
0.0
0.0
-216.47%
jan 1, 1999
-100.0
-100.0
110.07 trl%
jan 1, 2000
-100.0
0.0
0.0%
jan 1, 2001
1.529K
+1.629K
-1.63K%
jan 1, 2002
-99.918
-1.628K
-106.54%
jan 1, 2003
-99.688
+0.229
-0.23%
jan 1, 2004
-71.214
+28.475
-28.56%
jan 1, 2005
128.928
+200.141
-281.04%
jan 1, 2006
-70.745
-199.673
-154.87%
jan 1, 2007
-100.0
-29.255
41.35%
jan 1, 2008
9.165
+109.165
-109.17%
jan 1, 2009
-62.07
-71.235
-777.22%
jan 1, 2010
-99.19
-37.12
59.8%
jan 1, 2011
435.403
+534.593
-538.96%
jan 1, 2012
435.403
+0.0
0.0%
jan 1, 2013
435.403
0.0
0.0%
Ranking of countries by current statistics by years