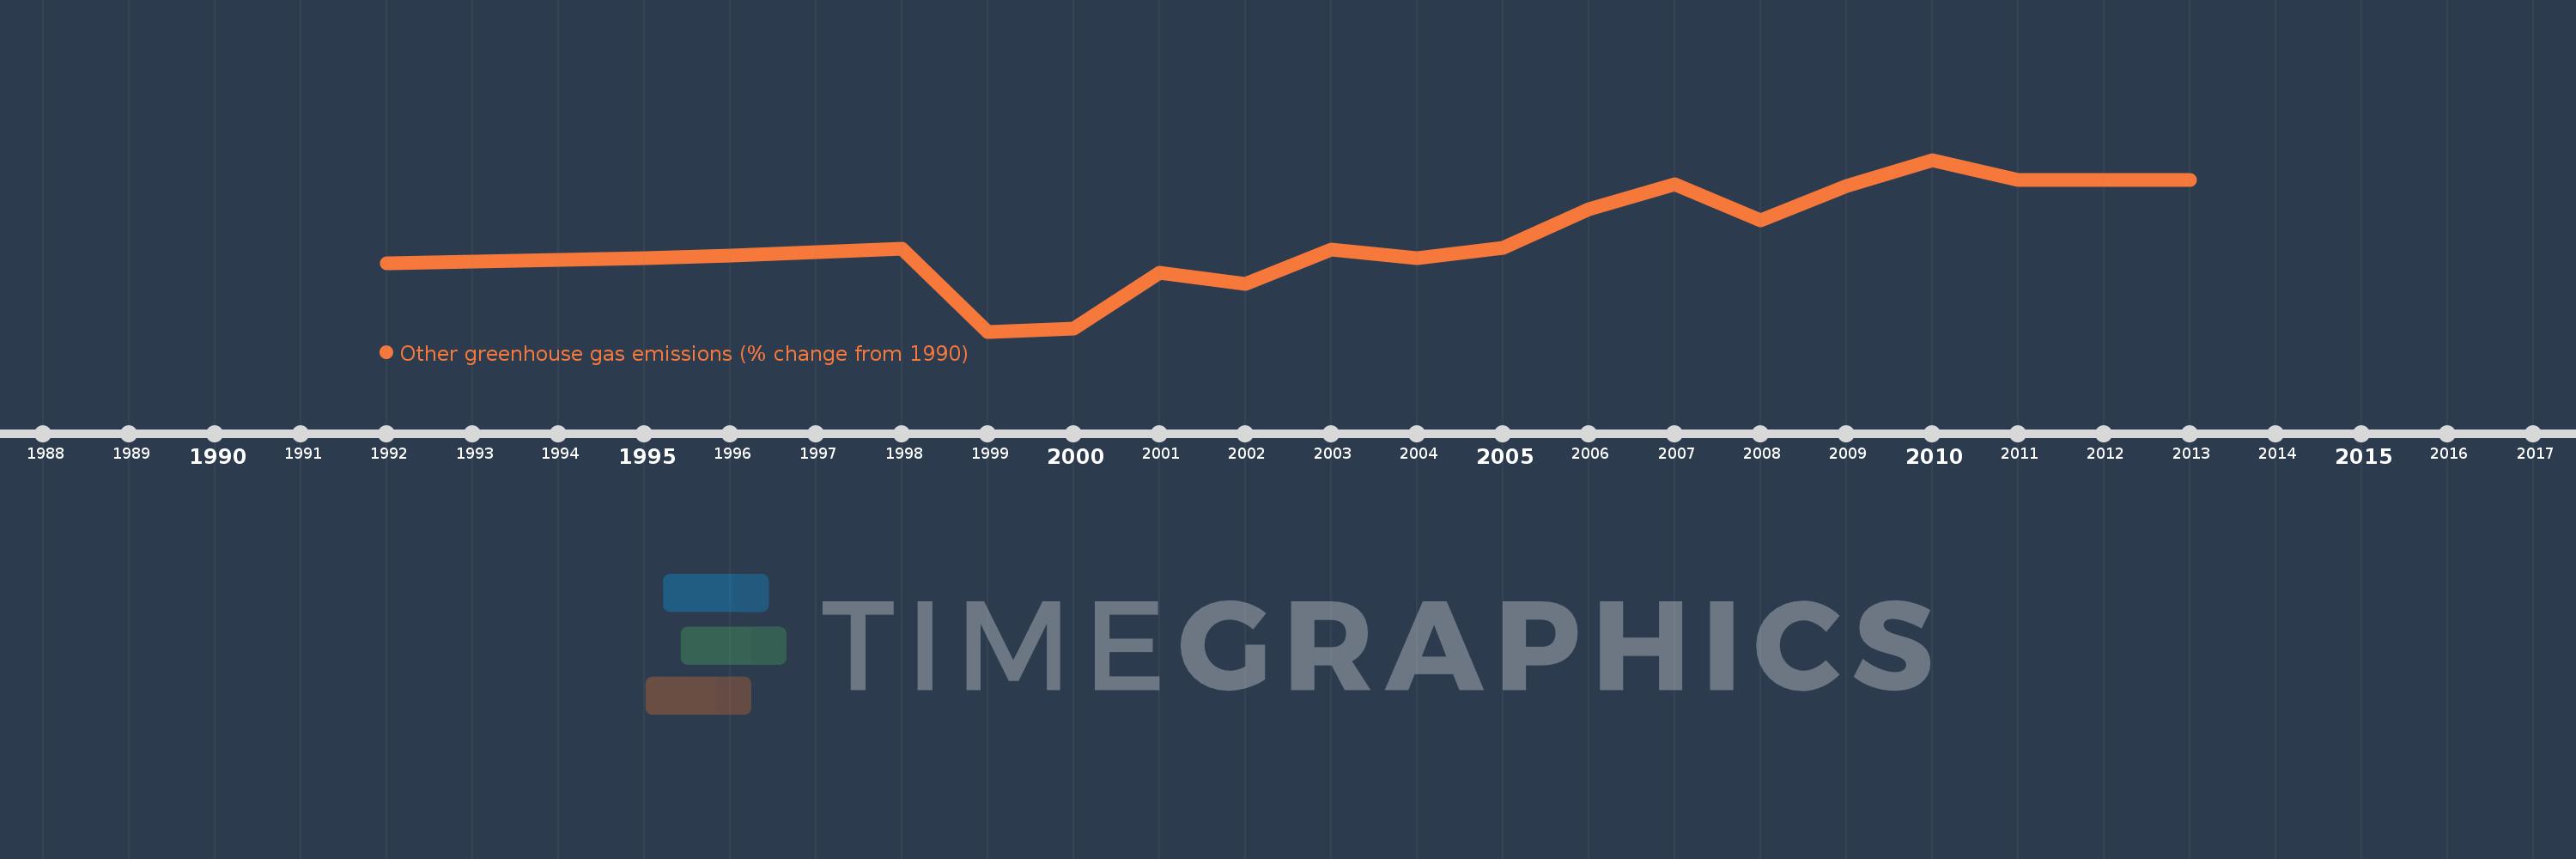
This timeline shows a graph from 1992 to 2013 of Jamaica. No data until 1991. Number of actual observations by date: 22.
Source name:
World Development Indicators
Source organization:
World Bank staff estimates from original source: European Commission, Joint Research Centre (JRC)/Netherlands Environmental Assessment Agency (PBL). Emission Database for Global Atmospheric Research (EDGAR): http://edgar.jrc.ec.europa.eu/.
Categories, topics:
Climate Change, Environment
Last updated:
apr 23, 2017
Indicators value changes by year
Meaning:
31.481
Minimum:
-87.001
jan 1, 1999
Maximum:
134.353
jan 1, 2010
At the date of observation
Value
Absolute change
Change from the previous value
jan 1, 1992
1.442
+1.442
0.0%
jan 1, 1993
2.969
+1.526
105.82%
jan 1, 1994
5.074
+2.106
70.94%
jan 1, 1995
7.671
+2.596
51.16%
jan 1, 1996
11.372
+3.701
48.25%
jan 1, 1997
15.635
+4.264
37.49%
jan 1, 1998
19.374
+3.738
23.91%
jan 1, 1999
-87.001
-106.375
-549.07%
jan 1, 2000
-82.877
+4.125
-4.74%
jan 1, 2001
-11.508
+71.368
-86.11%
jan 1, 2002
-26.007
-14.499
125.99%
jan 1, 2003
18.864
+44.871
-172.54%
jan 1, 2004
7.615
-11.249
-59.63%
jan 1, 2005
20.989
+13.374
175.62%
jan 1, 2006
70.734
+49.745
237.01%
jan 1, 2007
102.981
+32.247
45.59%
jan 1, 2008
56.361
-46.621
-45.27%
jan 1, 2009
100.981
+44.621
79.17%
jan 1, 2010
134.353
+33.372
33.05%
jan 1, 2011
107.856
-26.498
-19.72%
jan 1, 2012
107.856
0.0
0.0%
jan 1, 2013
107.856
0.0
0.0%
Ranking of countries by current statistics by years