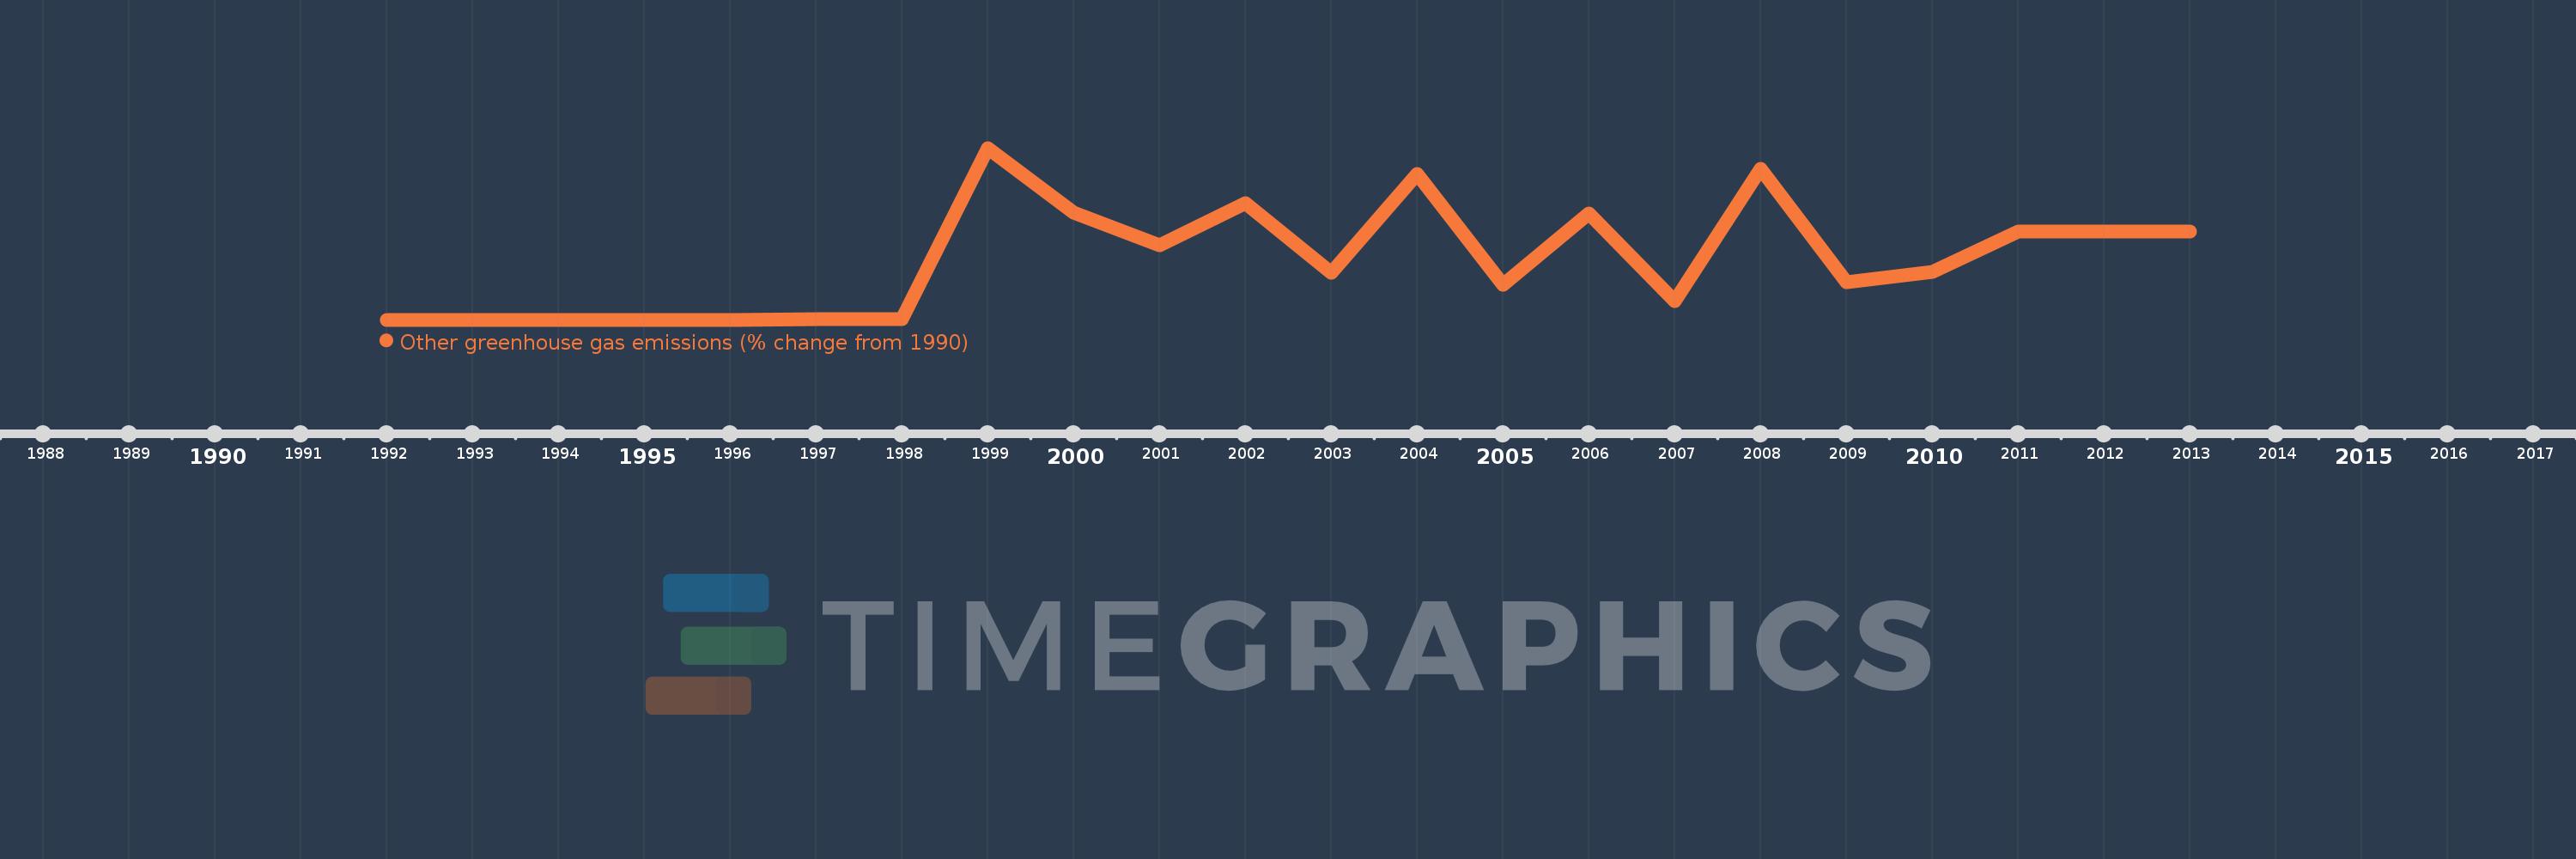
This timeline shows a graph from 1992 to 2013 of Lesotho. No data until 1991. Number of actual observations by date: 22.
Source name:
World Development Indicators
Source organization:
World Bank staff estimates from original source: European Commission, Joint Research Centre (JRC)/Netherlands Environmental Assessment Agency (PBL). Emission Database for Global Atmospheric Research (EDGAR): http://edgar.jrc.ec.europa.eu/.
Categories, topics:
Climate Change, Environment
Last updated:
apr 23, 2017
Indicators value changes by year
Meaning:
2.245K
Minimum:
1.282
jan 1, 1992
Maximum:
6.398K
jan 1, 1999
At the date of observation
Value
Absolute change
Change from the previous value
jan 1, 1992
1.282
+1.282
0.0%
jan 1, 1993
2.564
+1.282
99.97%
jan 1, 1994
3.846
+1.282
50.01%
jan 1, 1995
5.128
+1.282
33.34%
jan 1, 1996
6.41
+1.282
24.99%
jan 1, 1997
7.692
+1.282
20.0%
jan 1, 1998
8.975
+1.282
16.67%
jan 1, 1999
6.398K
+6.389K
71.19K%
jan 1, 2000
3.98K
-2.418K
-37.79%
jan 1, 2001
2.788K
-1.192K
-29.96%
jan 1, 2002
4.349K
+1.561K
55.98%
jan 1, 2003
1.756K
-2.593K
-59.63%
jan 1, 2004
5.438K
+3.682K
209.72%
jan 1, 2005
1.304K
-4.134K
-76.03%
jan 1, 2006
3.972K
+2.668K
204.69%
jan 1, 2007
698.824
-3.273K
-82.41%
jan 1, 2008
5.609K
+4.91K
702.68%
jan 1, 2009
1.404K
-4.206K
-74.98%
jan 1, 2010
1.789K
+385.143
27.44%
jan 1, 2011
3.29K
+1.501K
83.94%
jan 1, 2012
3.29K
0.0
0.0%
jan 1, 2013
3.29K
0.0
0.0%
Ranking of countries by current statistics by years