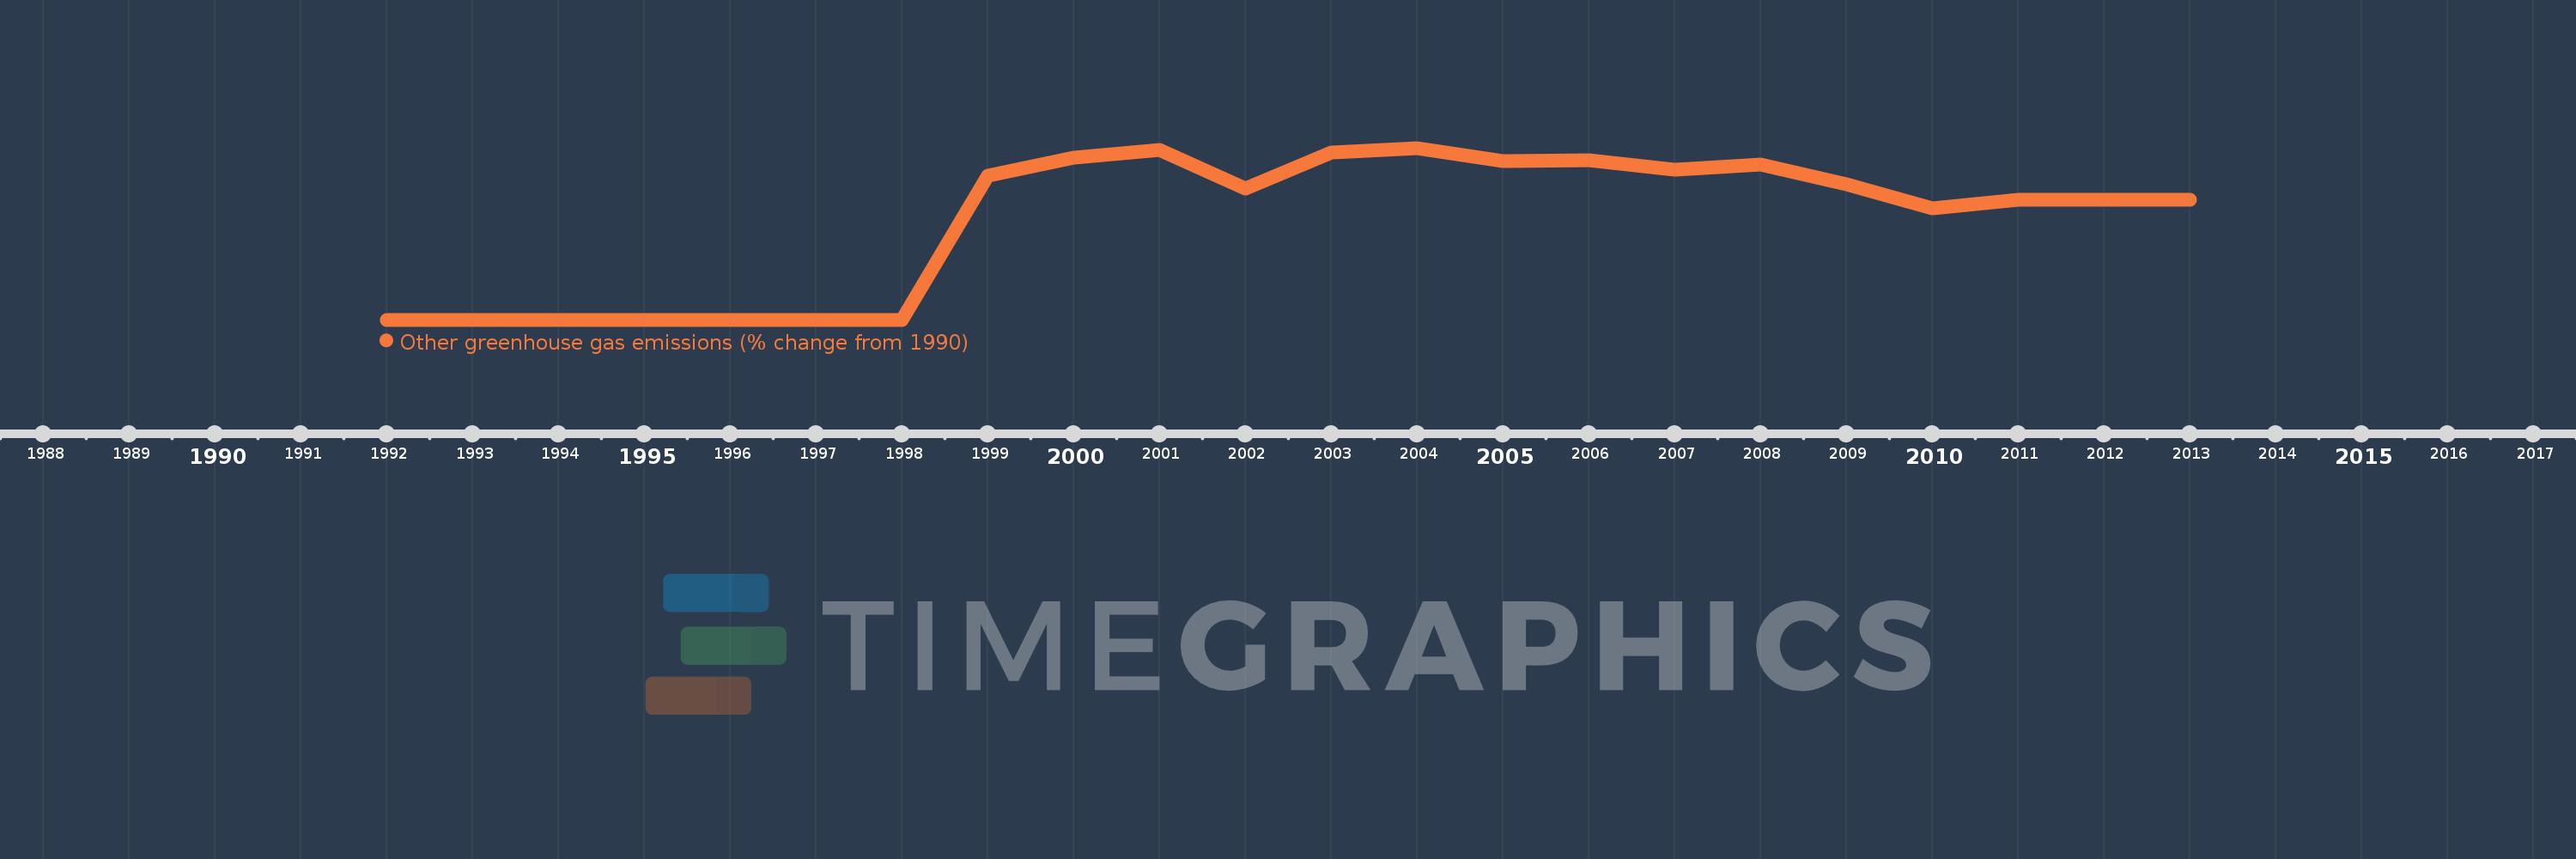
This timeline shows a graph from 1992 to 2013 of Chad. No data until 1991. Number of actual observations by date: 22.
Source name:
World Development Indicators
Source organization:
World Bank staff estimates from original source: European Commission, Joint Research Centre (JRC)/Netherlands Environmental Assessment Agency (PBL). Emission Database for Global Atmospheric Research (EDGAR): http://edgar.jrc.ec.europa.eu/.
Categories, topics:
Climate Change, Environment
Last updated:
apr 23, 2017
Indicators value changes by year
Meaning:
315.198K
Minimum:
0.0
jan 1, 1994
Maximum:
548.03K
jan 1, 2004
At the date of observation
Value
Absolute change
Change from the previous value
jan 1, 1992
0.0
0.0
0.0%
jan 1, 1993
0.0
0.0
%
jan 1, 1994
0.0
0.0
%
jan 1, 1995
0.0
+0.0
-100.0%
jan 1, 1996
0.0
+0.0
%
jan 1, 1997
0.0
0.0
-133.31%
jan 1, 1998
0.0
+0.0
-100.0%
jan 1, 1999
459.072K
+459.072K
%
jan 1, 2000
517.48K
+58.408K
12.72%
jan 1, 2001
541.58K
+24.1K
4.66%
jan 1, 2002
418.601K
-122.978K
-22.71%
jan 1, 2003
532.83K
+114.228K
27.29%
jan 1, 2004
548.03K
+15.2K
2.85%
jan 1, 2005
505.04K
-42.99K
-7.84%
jan 1, 2006
509.25K
+4.21K
0.83%
jan 1, 2007
477.397K
-31.852K
-6.25%
jan 1, 2008
494.373K
+16.975K
3.56%
jan 1, 2009
431.226K
-63.147K
-12.77%
jan 1, 2010
354.551K
-76.675K
-17.78%
jan 1, 2011
381.646K
+27.095K
7.64%
jan 1, 2012
381.646K
0.0
0.0%
jan 1, 2013
381.646K
+0.0
0.0%
Ranking of countries by current statistics by years