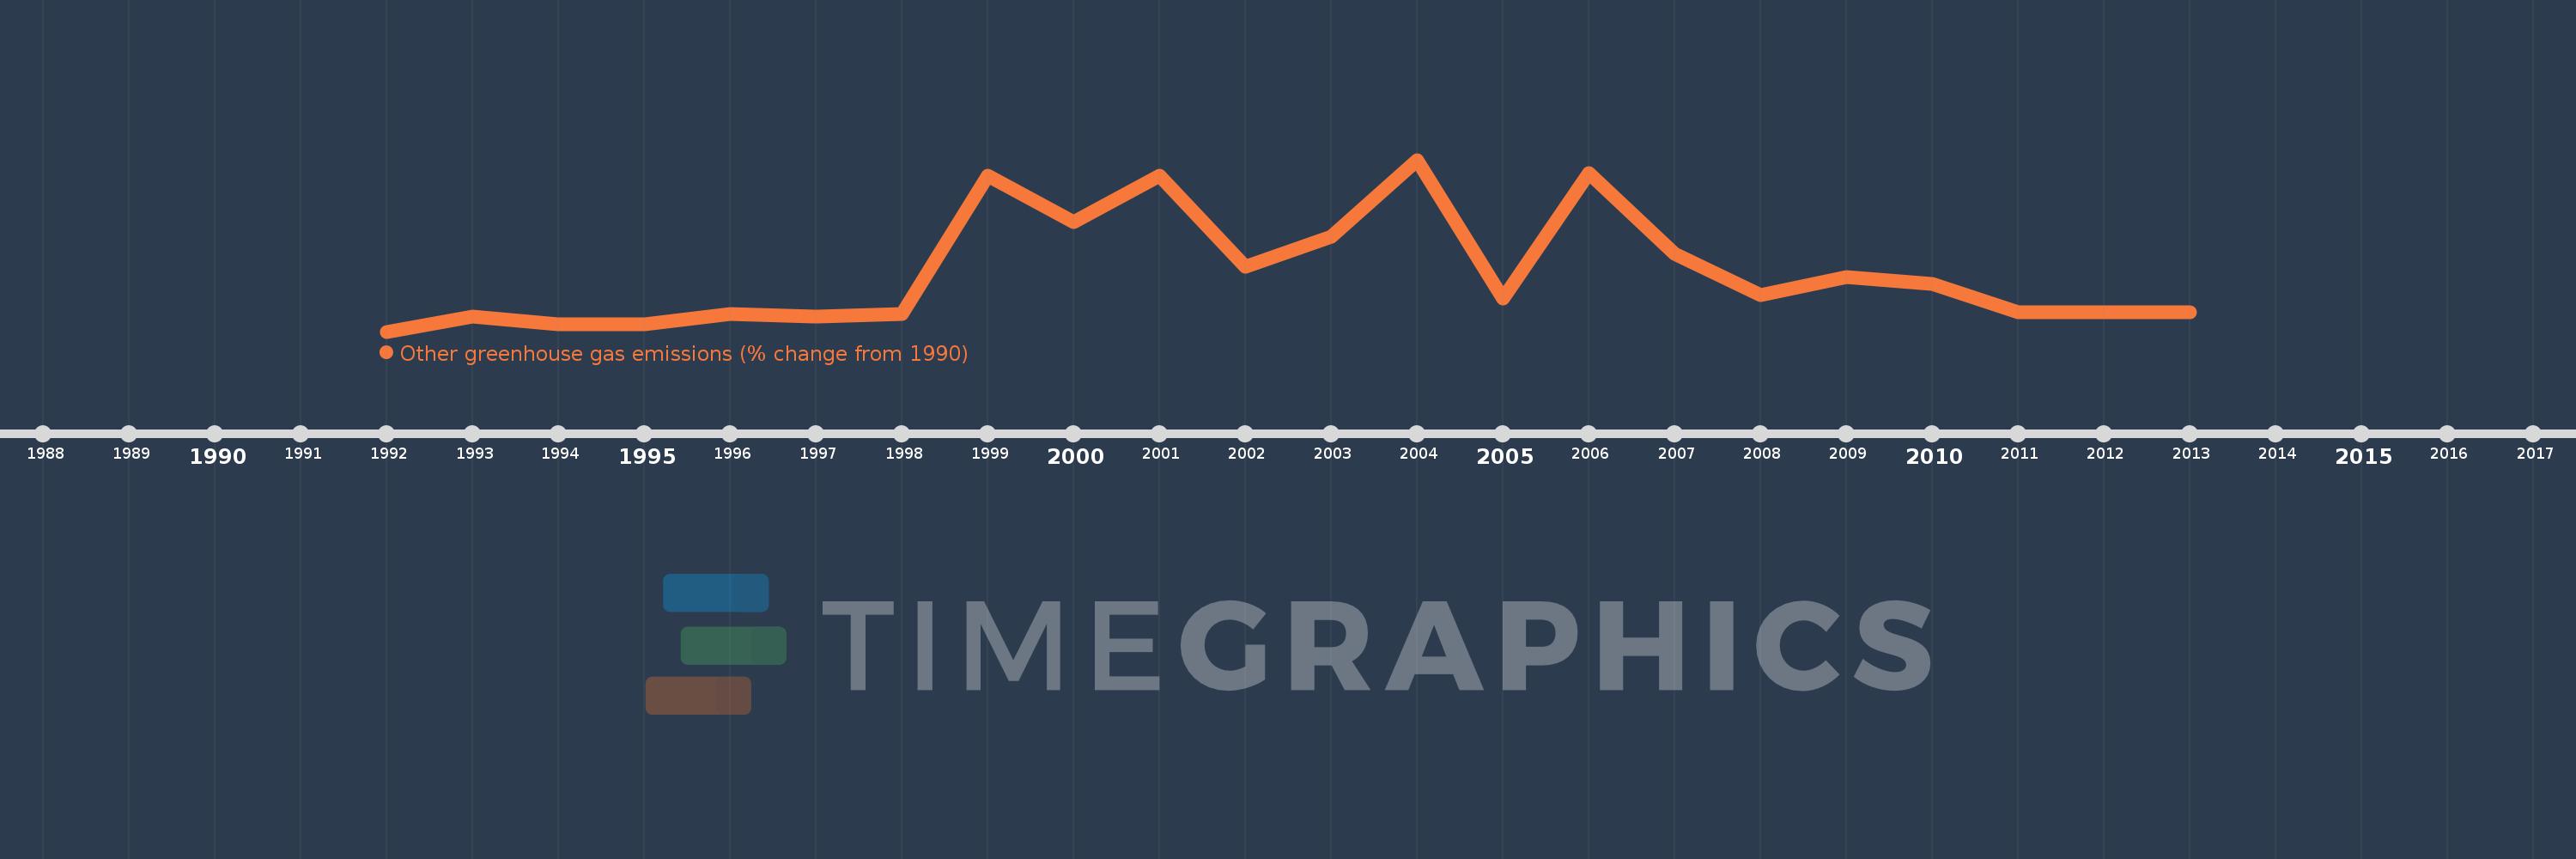
This timeline shows a graph from 1992 to 2013 of Cameroon. No data until 1991. Number of actual observations by date: 22.
Source name:
World Development Indicators
Source organization:
World Bank staff estimates from original source: European Commission, Joint Research Centre (JRC)/Netherlands Environmental Assessment Agency (PBL). Emission Database for Global Atmospheric Research (EDGAR): http://edgar.jrc.ec.europa.eu/.
Categories, topics:
Climate Change, Environment
Last updated:
apr 23, 2017
Indicators value changes by year
Meaning:
27.997
Minimum:
-18.823
jan 1, 1992
Maximum:
117.625
jan 1, 2004
At the date of observation
Value
Absolute change
Change from the previous value
jan 1, 1992
-18.823
-18.823
0.0%
jan 1, 1993
-6.699
+12.124
-64.41%
jan 1, 1994
-12.797
-6.099
91.05%
jan 1, 1995
-13.264
-0.467
3.65%
jan 1, 1996
-4.537
+8.727
-65.79%
jan 1, 1997
-6.85
-2.313
50.97%
jan 1, 1998
-5.094
+1.756
-25.63%
jan 1, 1999
104.906
+110.0
-2.16K%
jan 1, 2000
68.129
-36.777
-35.06%
jan 1, 2001
104.675
+36.545
53.64%
jan 1, 2002
32.984
-71.691
-68.49%
jan 1, 2003
56.503
+23.519
71.31%
jan 1, 2004
117.625
+61.122
108.17%
jan 1, 2005
7.126
-110.498
-93.94%
jan 1, 2006
107.15
+100.023
1.4K%
jan 1, 2007
42.808
-64.342
-60.05%
jan 1, 2008
9.928
-32.88
-76.81%
jan 1, 2009
24.238
+14.311
144.15%
jan 1, 2010
18.714
-5.524
-22.79%
jan 1, 2011
-3.599
-22.314
-119.23%
jan 1, 2012
-3.599
+0.0
0.0%
jan 1, 2013
-3.599
0.0
0.0%
Ranking of countries by current statistics by years