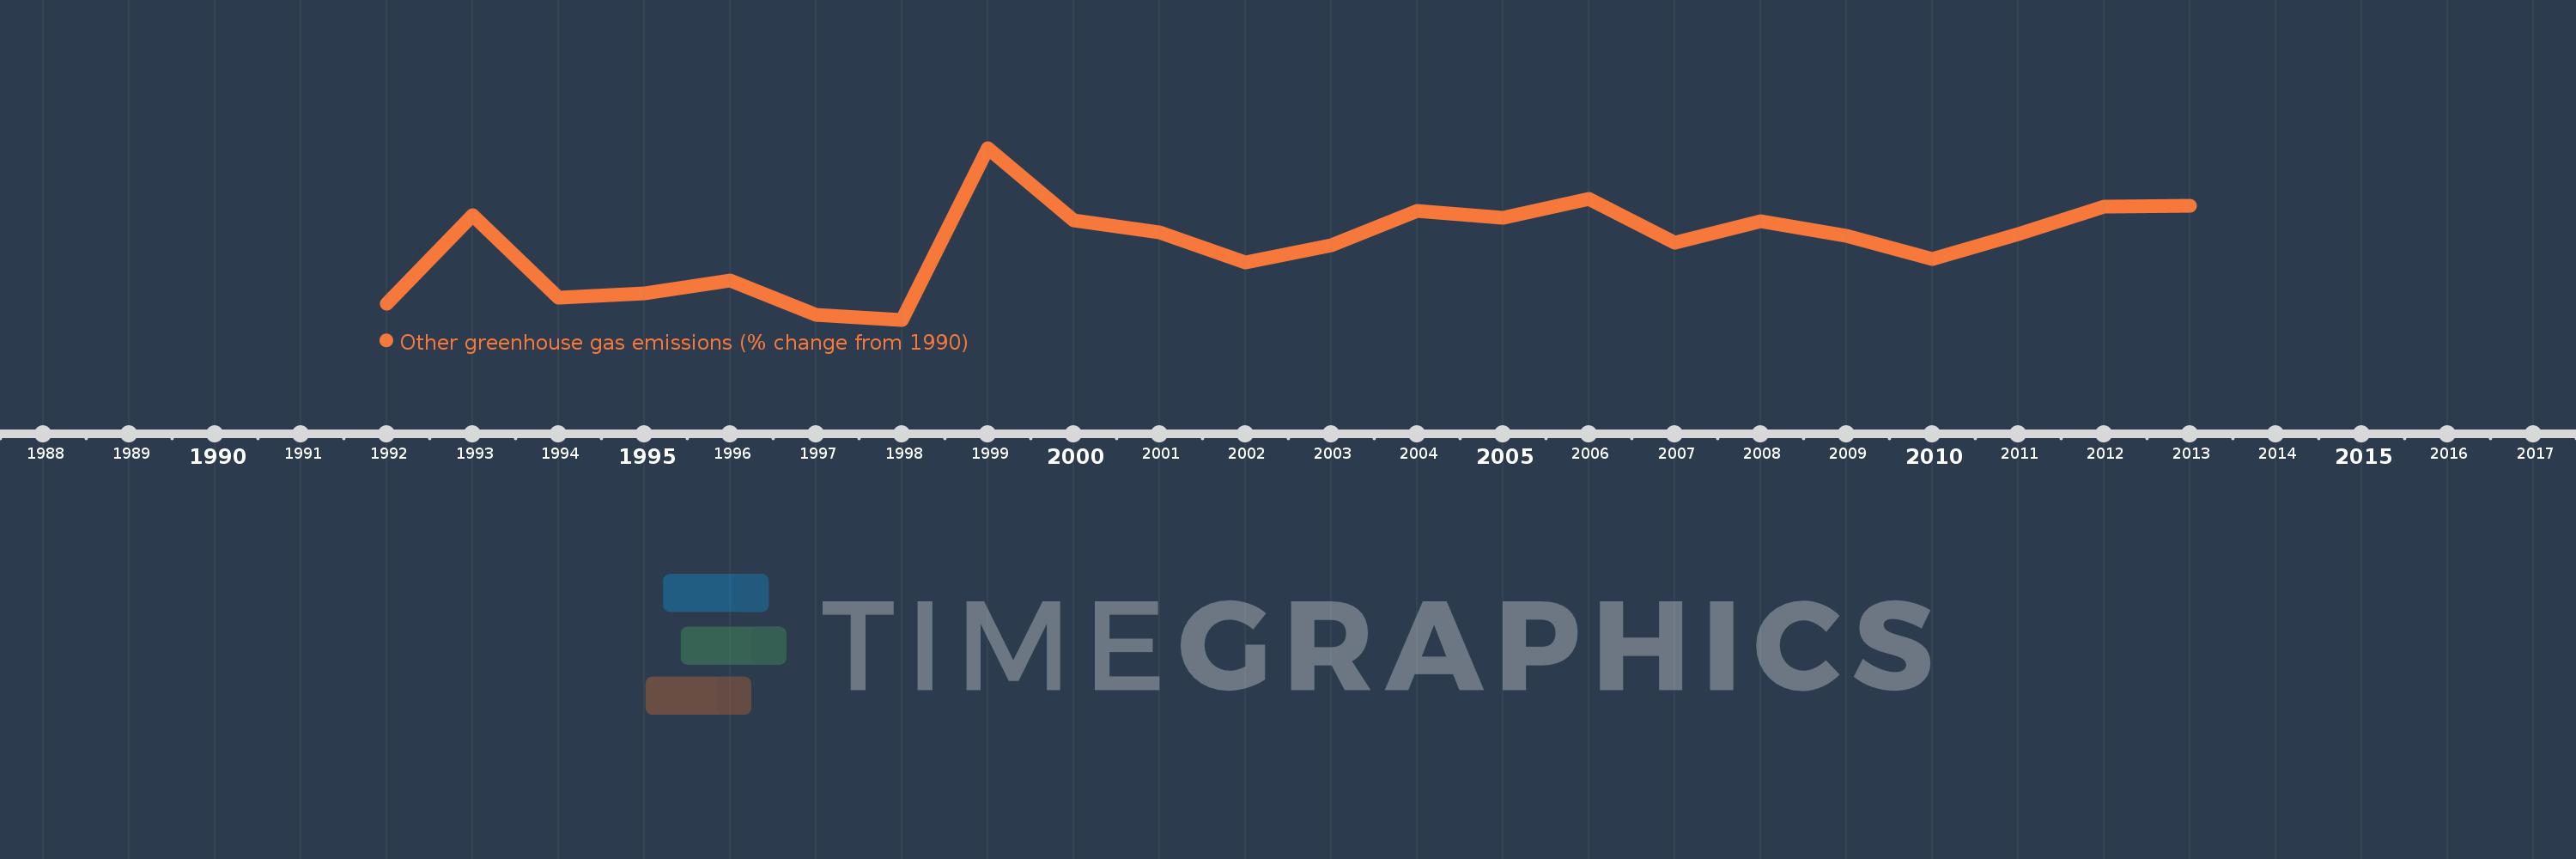
This timeline shows a graph from 1992 to 2013 of IDA only. No data until 1991. Number of actual observations by date: 22.
Source name:
World Development Indicators
Source organization:
World Bank staff estimates from original source: European Commission, Joint Research Centre (JRC)/Netherlands Environmental Assessment Agency (PBL). Emission Database for Global Atmospheric Research (EDGAR): http://edgar.jrc.ec.europa.eu/.
Categories, topics:
Climate Change, Environment
Last updated:
apr 23, 2017
Indicators value changes by year
Meaning:
13.147
Minimum:
-21.262
jan 1, 1998
Maximum:
56.682
jan 1, 1999
At the date of observation
Value
Absolute change
Change from the previous value
jan 1, 1992
-14.156
-14.156
0.0%
jan 1, 1993
26.215
+40.371
-285.18%
jan 1, 1994
-11.311
-37.526
-143.15%
jan 1, 1995
-9.269
+2.042
-18.06%
jan 1, 1996
-3.595
+5.674
-61.22%
jan 1, 1997
-19.143
-15.549
432.54%
jan 1, 1998
-21.262
-2.119
11.07%
jan 1, 1999
56.682
+77.944
-366.59%
jan 1, 2000
23.986
-32.696
-57.68%
jan 1, 2001
18.479
-5.507
-22.96%
jan 1, 2002
4.747
-13.732
-74.31%
jan 1, 2003
12.667
+7.92
166.83%
jan 1, 2004
28.138
+15.471
122.14%
jan 1, 2005
24.913
-3.225
-11.46%
jan 1, 2006
33.644
+8.731
35.05%
jan 1, 2007
13.819
-19.825
-58.93%
jan 1, 2008
23.434
+9.615
69.58%
jan 1, 2009
16.77
-6.664
-28.44%
jan 1, 2010
6.239
-10.531
-62.8%
jan 1, 2011
17.503
+11.264
180.55%
jan 1, 2012
30.22
+12.716
72.65%
jan 1, 2013
30.503
+0.283
0.94%
Ranking of countries by current statistics by years