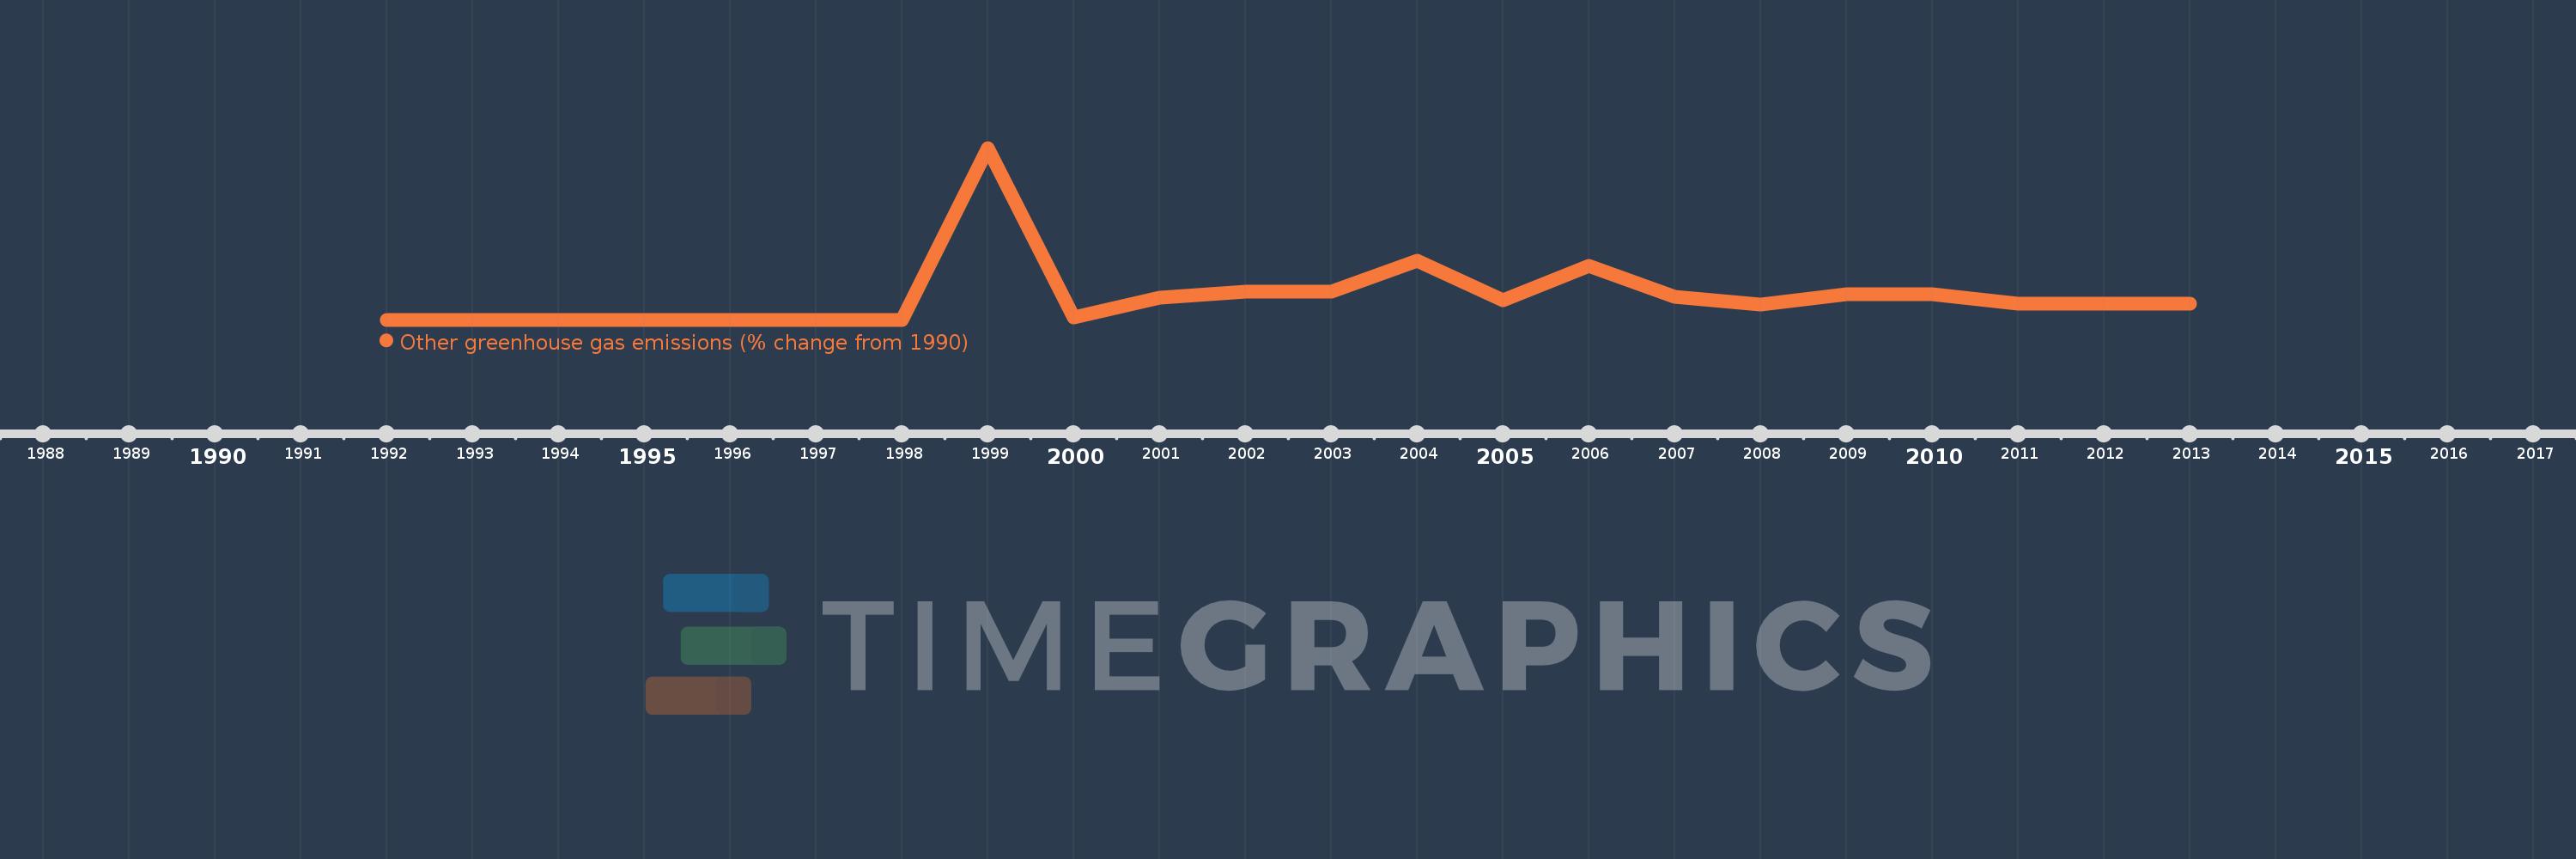
This timeline shows a graph from 1992 to 2013 of Nicaragua. No data until 1991. Number of actual observations by date: 22.
Source name:
World Development Indicators
Source organization:
World Bank staff estimates from original source: European Commission, Joint Research Centre (JRC)/Netherlands Environmental Assessment Agency (PBL). Emission Database for Global Atmospheric Research (EDGAR): http://edgar.jrc.ec.europa.eu/.
Categories, topics:
Climate Change, Environment
Last updated:
apr 23, 2017
Indicators value changes by year
Meaning:
277.281
Minimum:
0.0
jan 1, 1993
Maximum:
2.013K
jan 1, 1999
At the date of observation
Value
Absolute change
Change from the previous value
jan 1, 1992
0.0
0.0
0.0%
jan 1, 1993
0.0
0.0
%
jan 1, 1994
0.0
+0.0
-100.0%
jan 1, 1995
0.0
0.0
%
jan 1, 1996
0.0
0.0
0.0%
jan 1, 1997
0.0
+0.0
-100.0%
jan 1, 1998
0.0
0.0
%
jan 1, 1999
2.013K
+2.013K
%
jan 1, 2000
26.004
-1.987K
-98.71%
jan 1, 2001
256.272
+230.268
885.51%
jan 1, 2002
328.938
+72.665
28.35%
jan 1, 2003
328.38
-0.558
-0.17%
jan 1, 2004
690.175
+361.795
110.18%
jan 1, 2005
224.197
-465.977
-67.52%
jan 1, 2006
631.388
+407.19
181.62%
jan 1, 2007
265.475
-365.913
-57.95%
jan 1, 2008
182.59
-82.885
-31.22%
jan 1, 2009
298.36
+115.77
63.4%
jan 1, 2010
300.117
+1.757
0.59%
jan 1, 2011
185.212
-114.905
-38.29%
jan 1, 2012
185.213
+0.0
0.0%
jan 1, 2013
185.213
+0.0
0.0%
Ranking of countries by current statistics by years