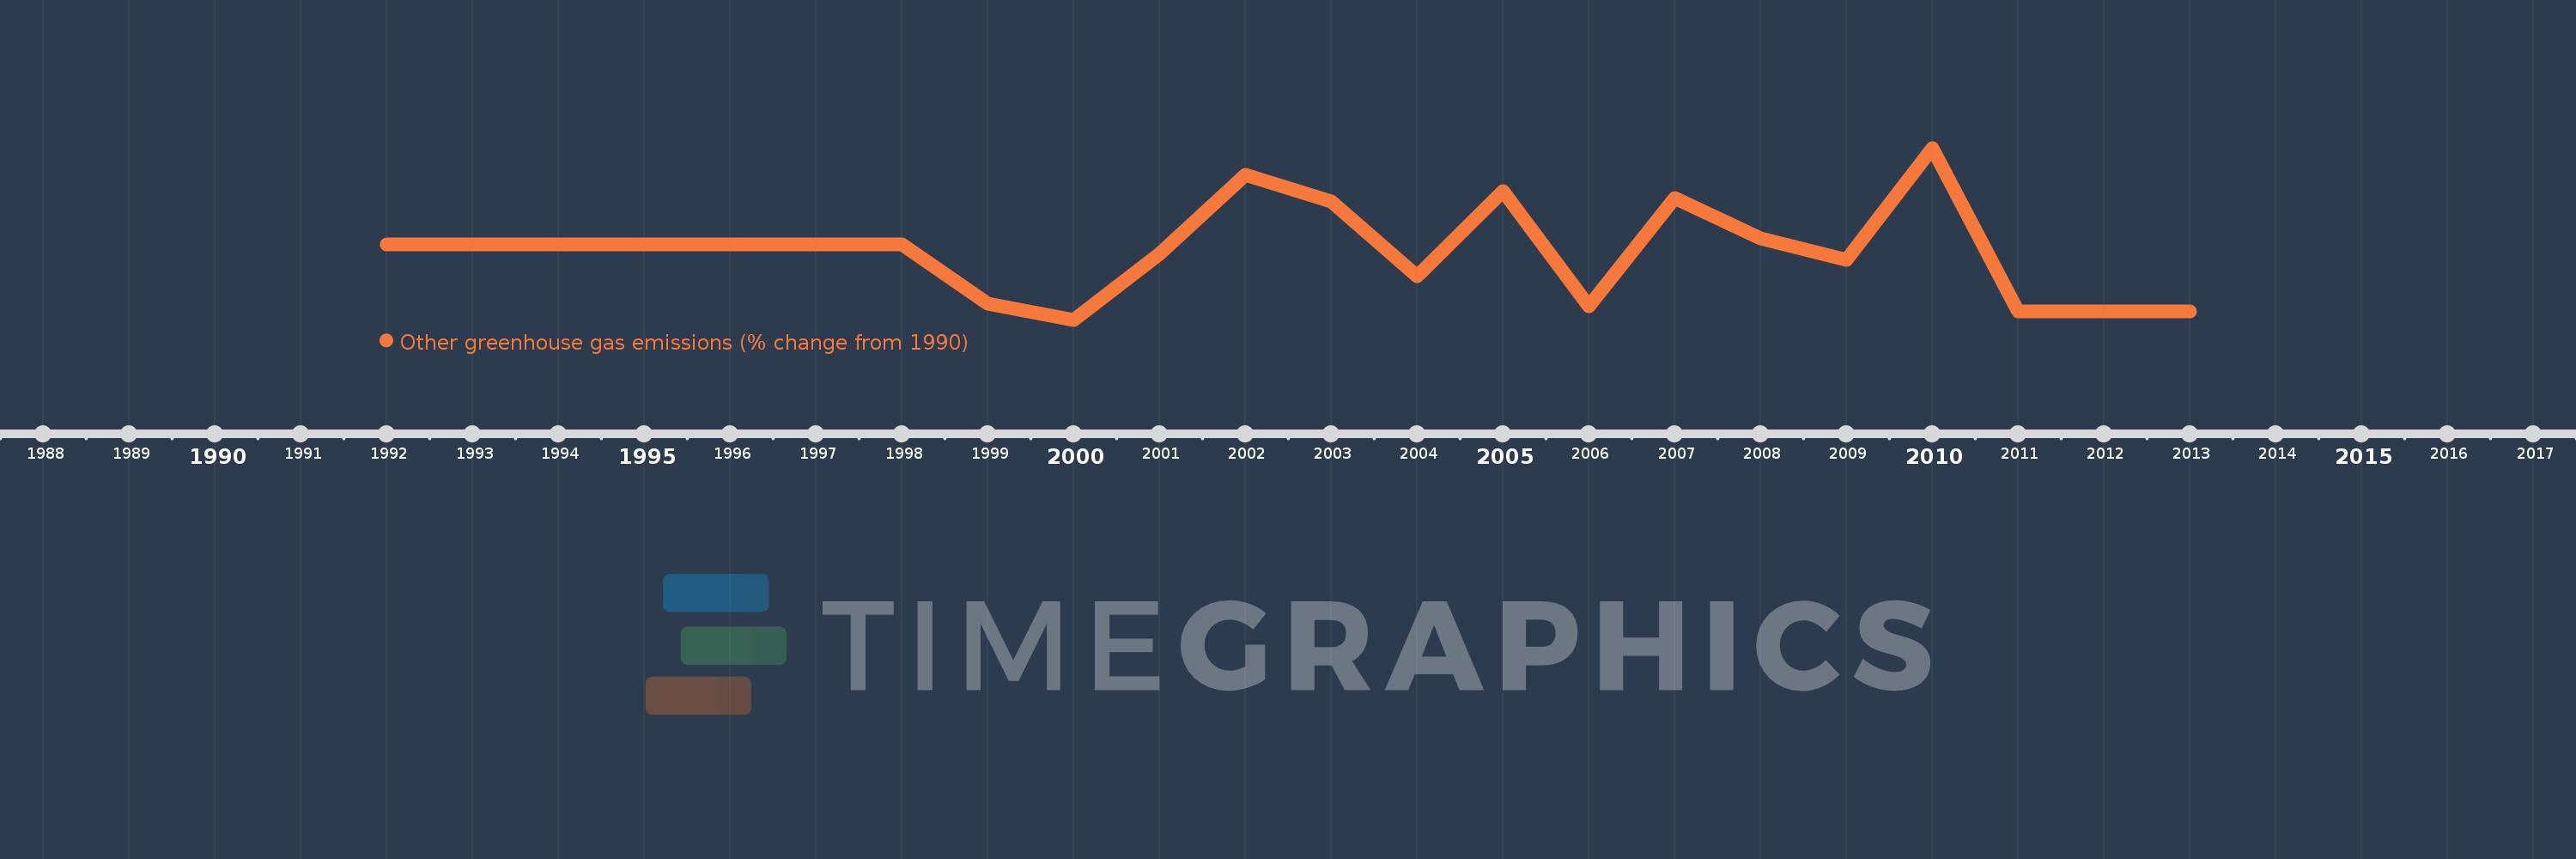
This timeline shows a graph from 1992 to 2013 of Panama. No data until 1991. Number of actual observations by date: 22.
Source name:
World Development Indicators
Source organization:
World Bank staff estimates from original source: European Commission, Joint Research Centre (JRC)/Netherlands Environmental Assessment Agency (PBL). Emission Database for Global Atmospheric Research (EDGAR): http://edgar.jrc.ec.europa.eu/.
Categories, topics:
Climate Change, Environment
Last updated:
apr 23, 2017
Indicators value changes by year
Meaning:
-6.673
Minimum:
-78.25
jan 1, 2000
Maximum:
99.695
jan 1, 2010
At the date of observation
Value
Absolute change
Change from the previous value
jan 1, 1992
0.0
0.0
0.0%
jan 1, 1993
0.0
0.0
%
jan 1, 1994
0.0
0.0
%
jan 1, 1995
0.0
+0.0
-100.0%
jan 1, 1996
0.0
0.0
%
jan 1, 1997
0.0
+0.0
-204.35%
jan 1, 1998
0.0
0.0
-100.0%
jan 1, 1999
-62.0
-62.0
%
jan 1, 2000
-78.25
-16.25
26.21%
jan 1, 2001
-10.25
+68.0
-86.9%
jan 1, 2002
71.848
+82.098
-800.96%
jan 1, 2003
44.452
-27.396
-38.13%
jan 1, 2004
-33.443
-77.895
-175.23%
jan 1, 2005
55.226
+88.669
-265.14%
jan 1, 2006
-64.024
-119.25
-215.93%
jan 1, 2007
47.642
+111.666
-174.41%
jan 1, 2008
6.089
-41.553
-87.22%
jan 1, 2009
-16.162
-22.25
-365.42%
jan 1, 2010
99.695
+115.856
-716.87%
jan 1, 2011
-69.209
-168.903
-169.42%
jan 1, 2012
-69.209
0.0
0.0%
jan 1, 2013
-69.208
+0.0
0.0%
Ranking of countries by current statistics by years