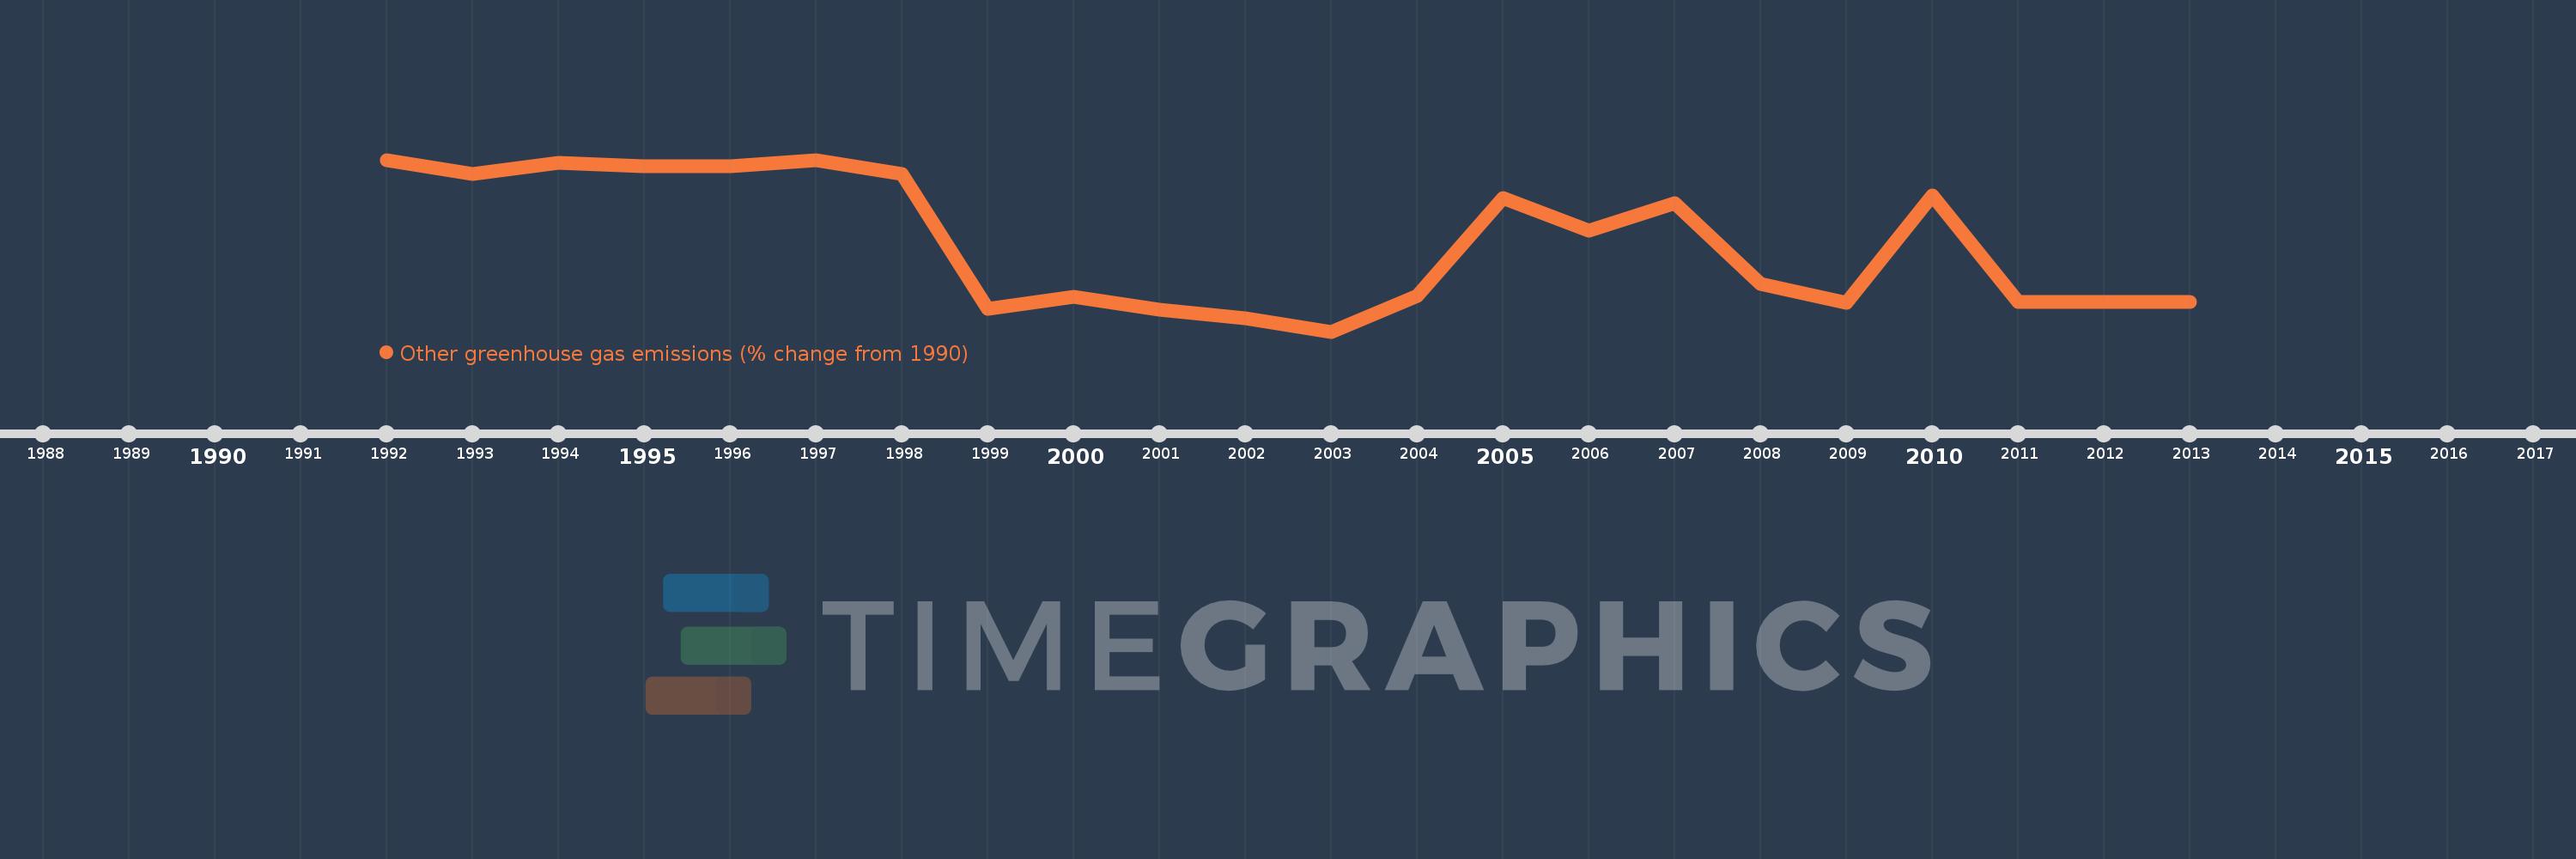
This timeline shows a graph from 1992 to 2013 of Cuba. No data until 1991. Number of actual observations by date: 22.
Source name:
World Development Indicators
Source organization:
World Bank staff estimates from original source: European Commission, Joint Research Centre (JRC)/Netherlands Environmental Assessment Agency (PBL). Emission Database for Global Atmospheric Research (EDGAR): http://edgar.jrc.ec.europa.eu/.
Categories, topics:
Climate Change, Environment
Last updated:
apr 23, 2017
Indicators value changes by year
Meaning:
-36.33
Minimum:
-84.71
jan 1, 2003
Maximum:
9.012
jan 1, 1992
At the date of observation
Value
Absolute change
Change from the previous value
jan 1, 1992
9.012
+9.012
0.0%
jan 1, 1993
1.503
-7.509
-83.33%
jan 1, 1994
7.574
+6.071
404.01%
jan 1, 1995
5.488
-2.086
-27.54%
jan 1, 1996
5.439
-0.049
-0.89%
jan 1, 1997
8.825
+3.386
62.25%
jan 1, 1998
1.142
-7.684
-87.06%
jan 1, 1999
-72.492
-73.634
-6.45K%
jan 1, 2000
-65.617
+6.875
-9.48%
jan 1, 2001
-72.532
-6.915
10.54%
jan 1, 2002
-77.458
-4.925
6.79%
jan 1, 2003
-84.71
-7.253
9.36%
jan 1, 2004
-65.367
+19.344
-22.84%
jan 1, 2005
-11.672
+53.695
-82.14%
jan 1, 2006
-29.698
-18.026
154.44%
jan 1, 2007
-14.689
+15.009
-50.54%
jan 1, 2008
-58.877
-44.188
300.83%
jan 1, 2009
-68.98
-10.103
17.16%
jan 1, 2010
-10.43
+58.55
-84.88%
jan 1, 2011
-68.574
-58.144
557.46%
jan 1, 2012
-68.574
0.0
0.0%
jan 1, 2013
-68.574
+0.0
0.0%
Ranking of countries by current statistics by years