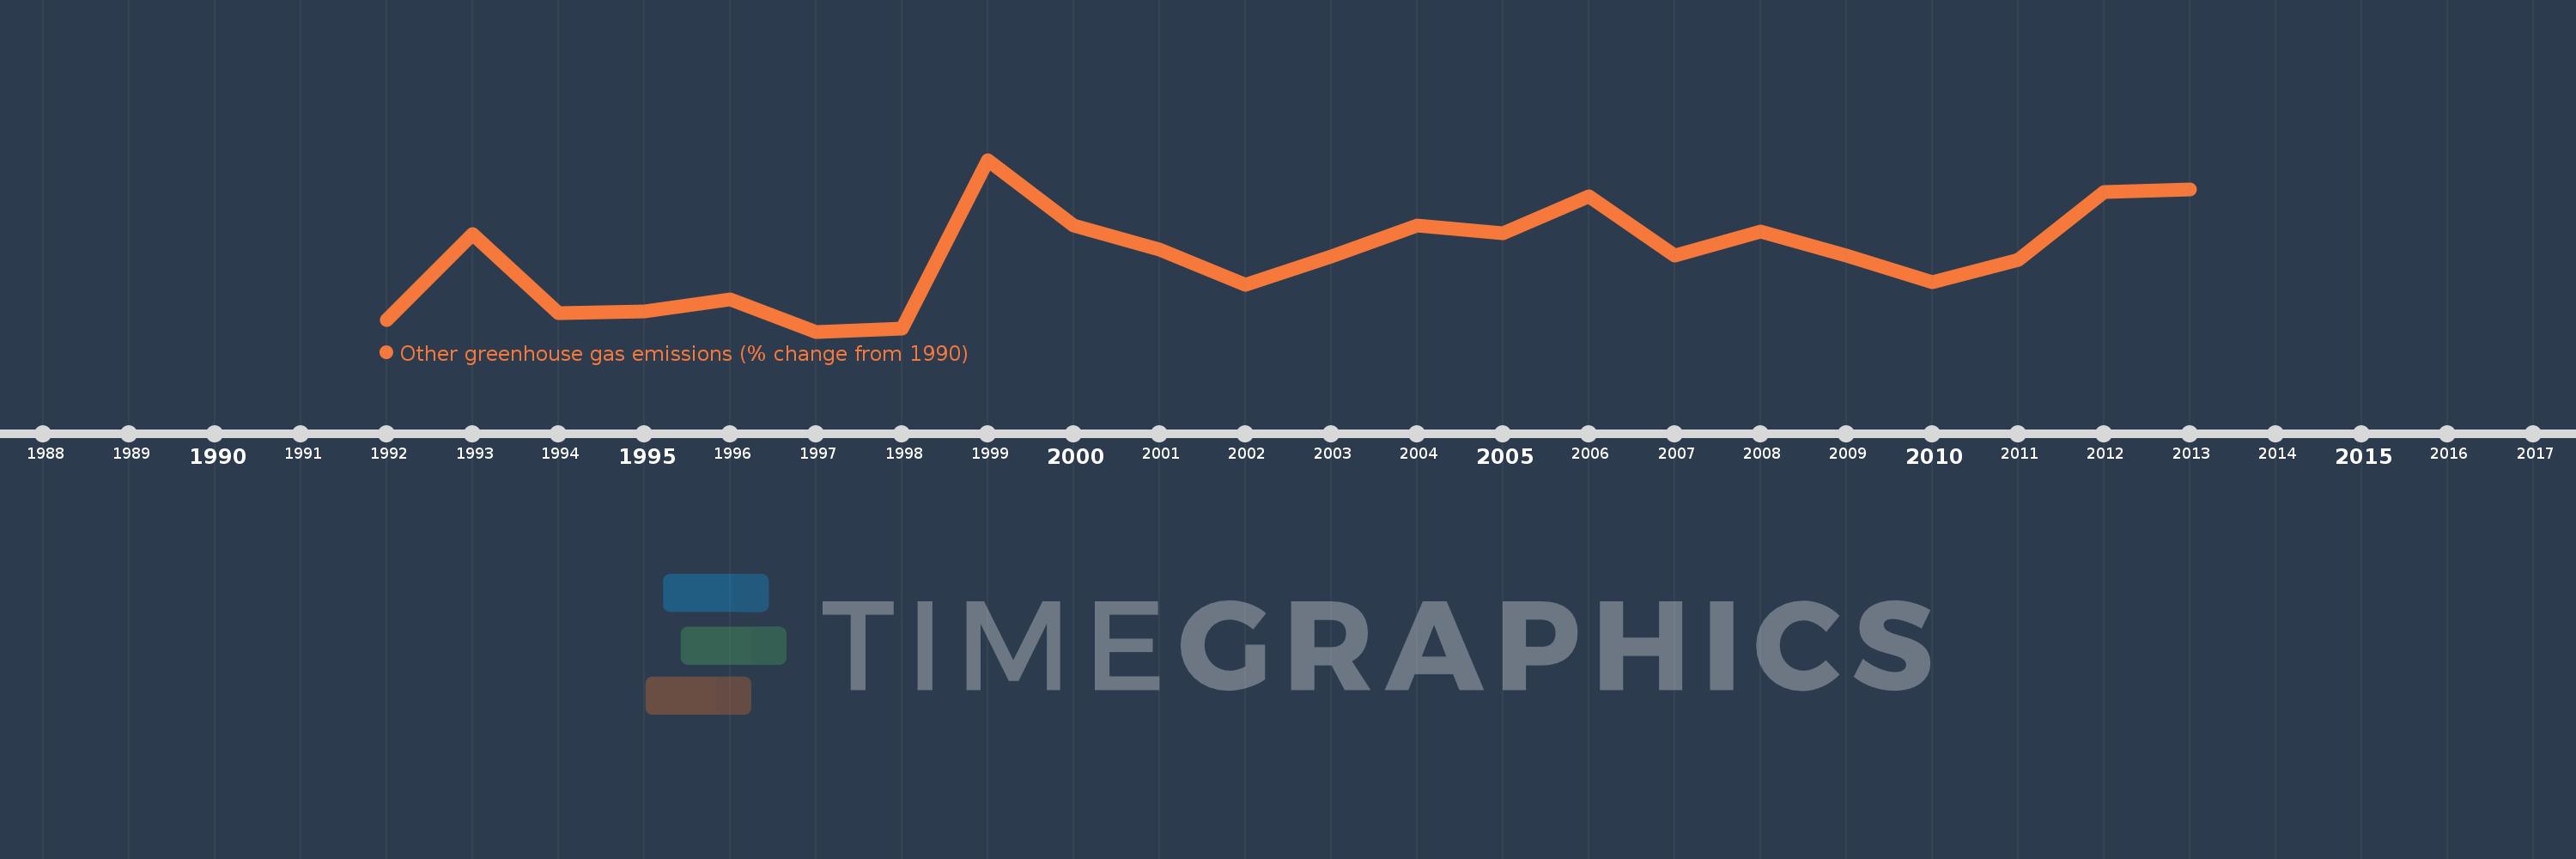
This timeline shows a graph from 1992 to 2013 of IDA total. No data until 1991. Number of actual observations by date: 22.
Source name:
World Development Indicators
Source organization:
World Bank staff estimates from original source: European Commission, Joint Research Centre (JRC)/Netherlands Environmental Assessment Agency (PBL). Emission Database for Global Atmospheric Research (EDGAR): http://edgar.jrc.ec.europa.eu/.
Categories, topics:
Climate Change, Environment
Last updated:
apr 23, 2017
Indicators value changes by year
Meaning:
14.826
Minimum:
-17.722
jan 1, 1997
Maximum:
56.462
jan 1, 1999
At the date of observation
Value
Absolute change
Change from the previous value
jan 1, 1992
-12.693
-12.693
0.0%
jan 1, 1993
24.372
+37.066
-292.01%
jan 1, 1994
-9.863
-34.236
-140.47%
jan 1, 1995
-8.928
+0.935
-9.48%
jan 1, 1996
-3.875
+5.053
-56.6%
jan 1, 1997
-17.722
-13.846
357.28%
jan 1, 1998
-16.519
+1.202
-6.78%
jan 1, 1999
56.462
+72.981
-441.79%
jan 1, 2000
28.004
-28.458
-50.4%
jan 1, 2001
17.67
-10.334
-36.9%
jan 1, 2002
2.493
-15.176
-85.89%
jan 1, 2003
14.553
+12.059
483.65%
jan 1, 2004
27.948
+13.395
92.05%
jan 1, 2005
24.879
-3.069
-10.98%
jan 1, 2006
40.515
+15.636
62.85%
jan 1, 2007
14.987
-25.528
-63.01%
jan 1, 2008
25.52
+10.533
70.28%
jan 1, 2009
15.179
-10.341
-40.52%
jan 1, 2010
3.575
-11.604
-76.45%
jan 1, 2011
13.406
+9.831
274.97%
jan 1, 2012
42.63
+29.224
218.0%
jan 1, 2013
43.576
+0.946
2.22%
Ranking of countries by current statistics by years